シートにある全グラフの設定を取得し、変更を加えてから更新するマクロを作成したので紹介する
はじめに
シートにある全グラフの設定を取得し、変更を加えてから更新するマクロを作成したので紹介する
こんな感じで複数のシートにまたがってたくさんのグラフがあるときに
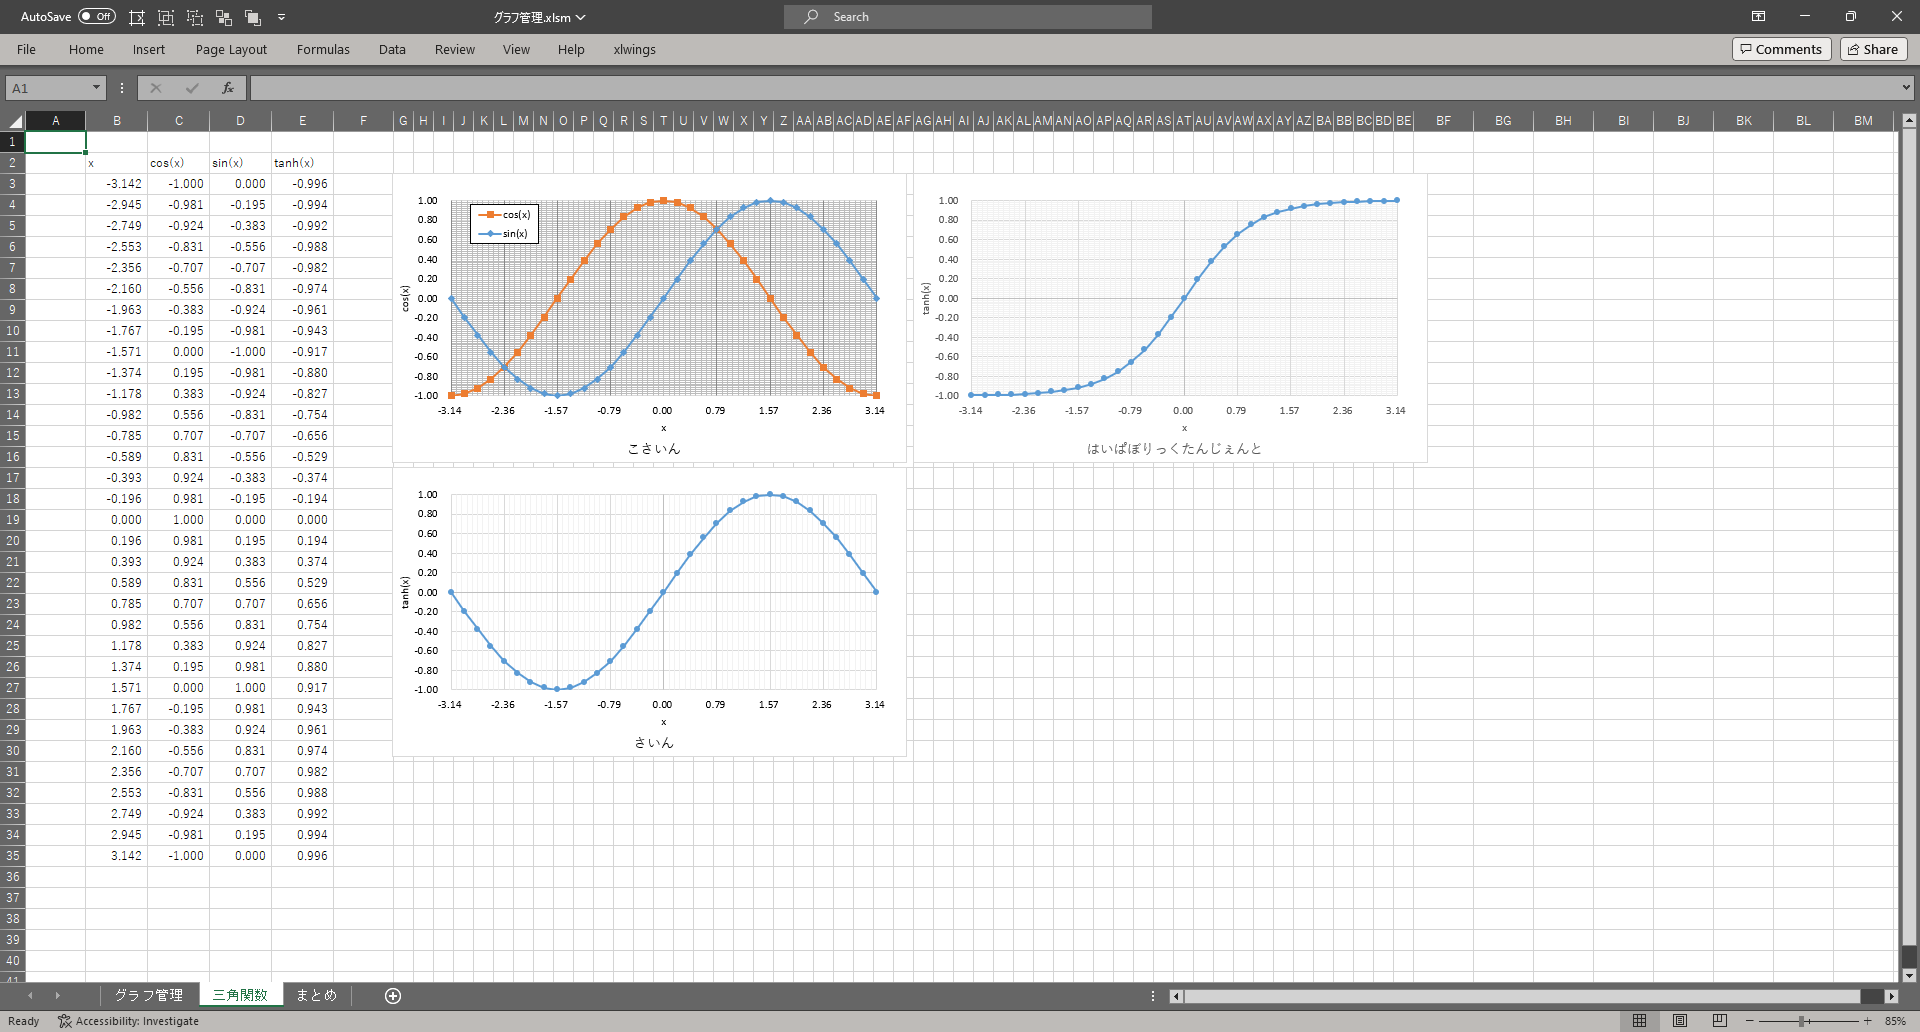
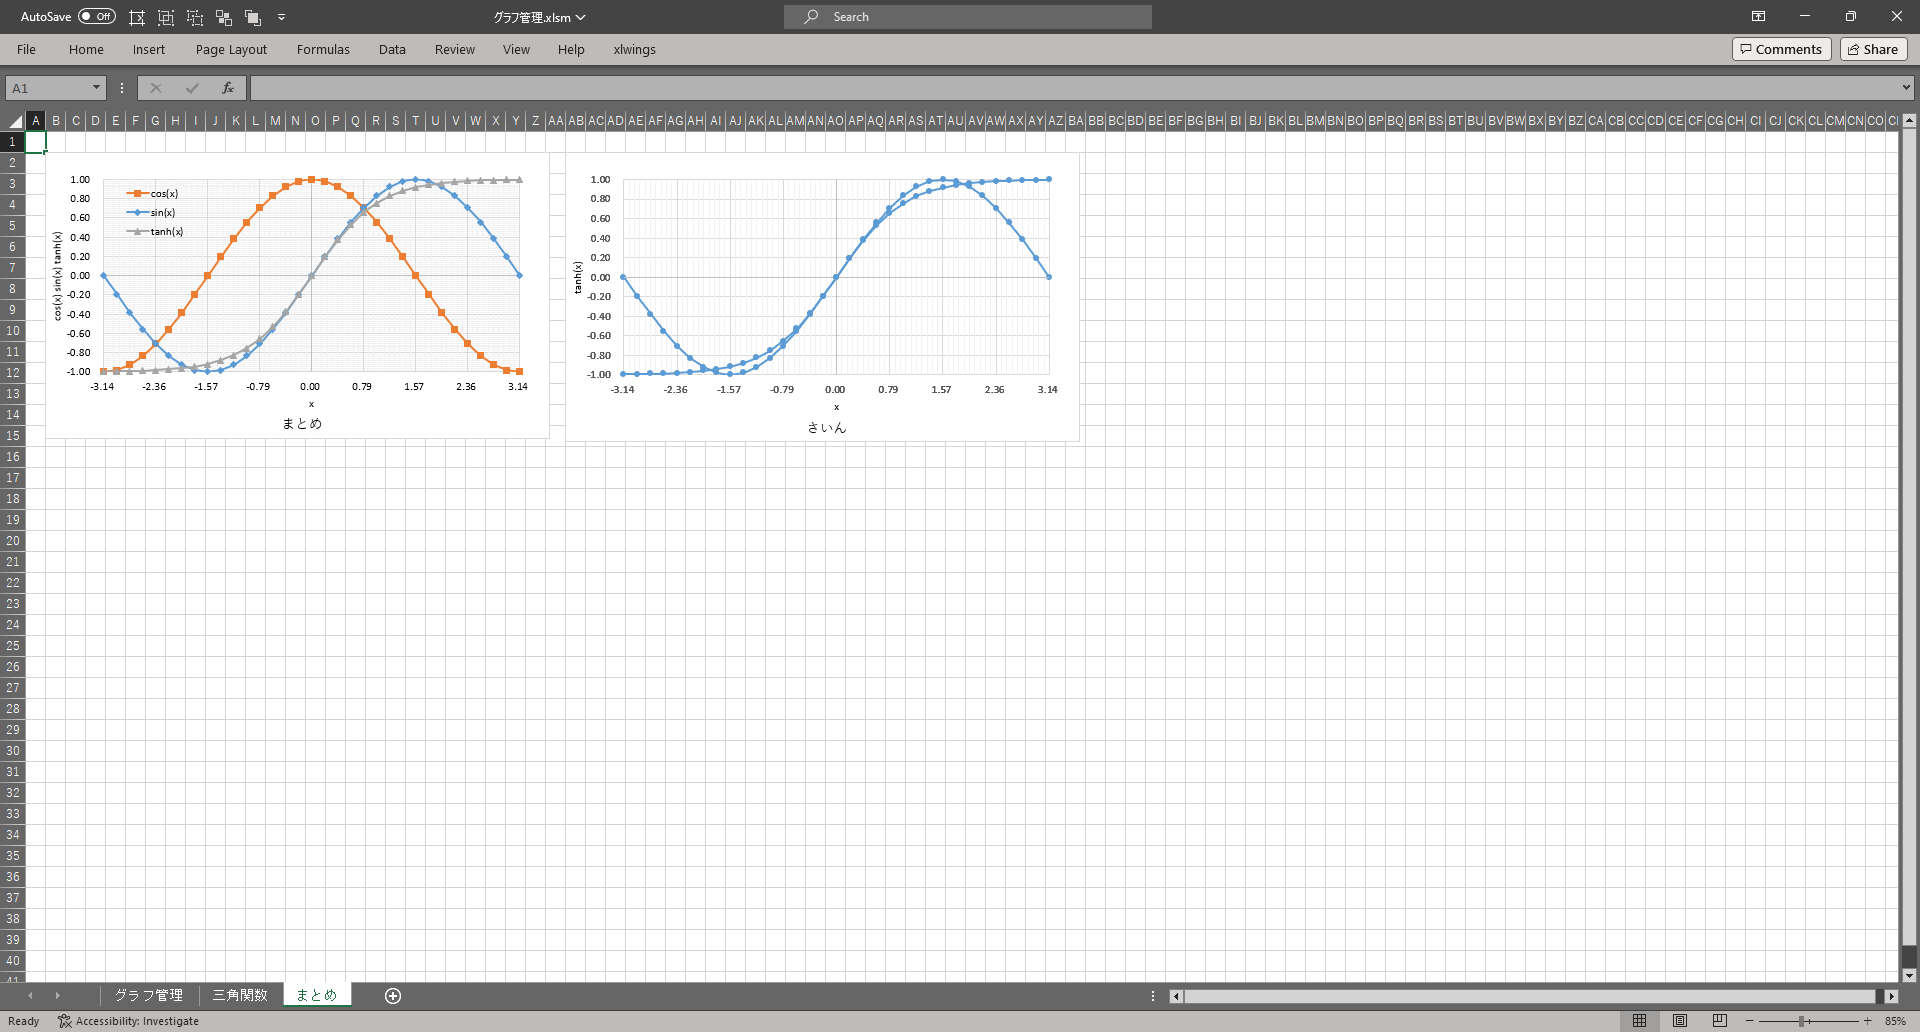
今回のマクロをぽちっと実行すると、「グラフ管理」というシートに全シートの全グラフの書式などの設定が書き出される
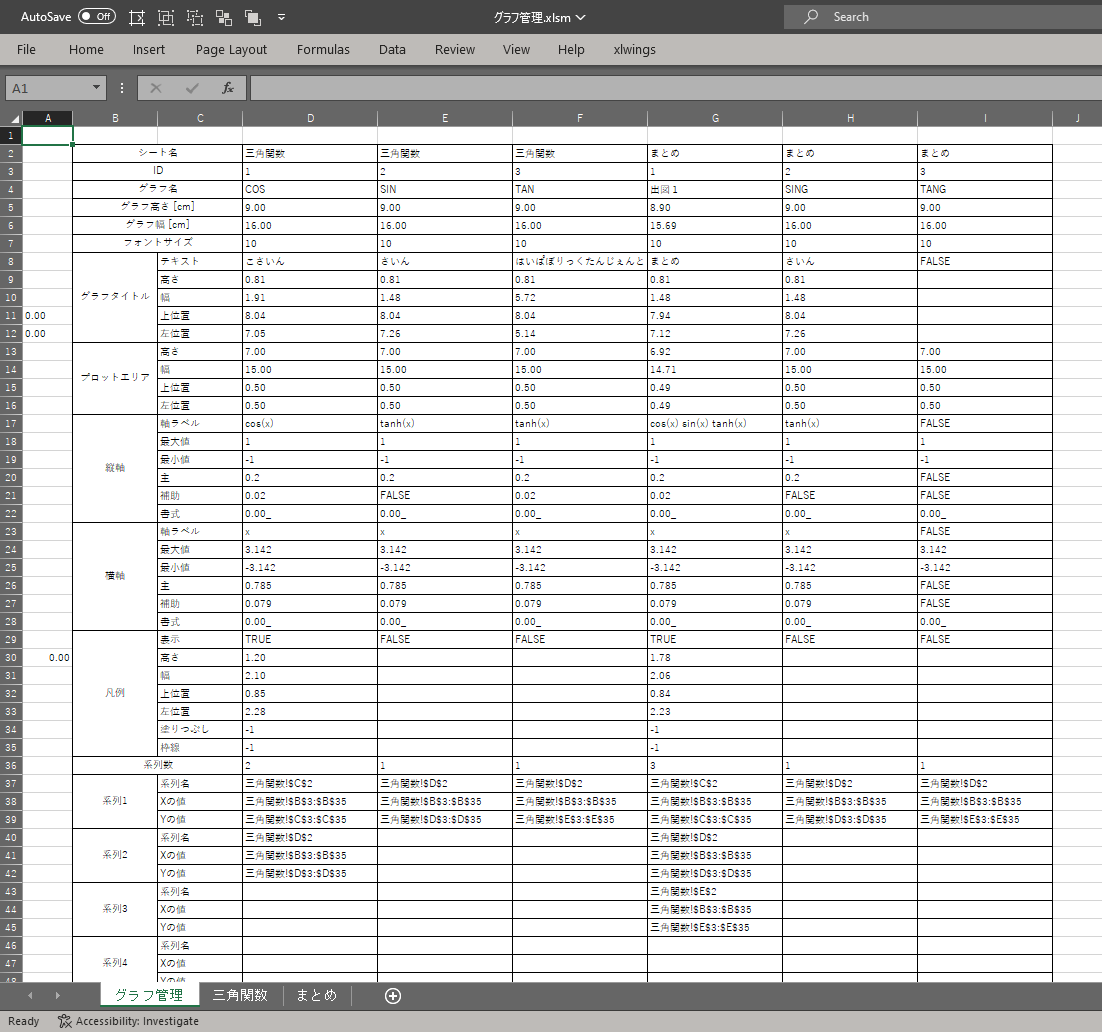
これを好きなように書き換えて、またマクロをぽちっと実行すると、変更がグラフに反映される
そんなマクロである
↓マクロ付きエクエルファイルのダウンロード
ソースコード
ソースコードはこれ
Const CmToPT As Double = 28.34645669291
Sub ExportGraphSettingToSheets()
    ' グラフの設定をシートにエクスポートするサブルーチン

    Dim sht0 As Worksheet ' グラフ管理シート
    Dim chartObj As Variant ' グラフオブジェクト
    Dim cnt As Long ' カウンター

    Set sht0 = Sheets("グラフ管理") ' "グラフ管理"シートをセット

    ' グラフの設定を含むセルの範囲を取得
    obj = sht0.Range(sht0.Range("D2"), sht0.Range("D2").End(xlToRight))

    ' 各グラフの設定を処理
    For cnt = 0 To UBound(obj, 2) - 1

        ' グラフオブジェクトを取得
        Set chartObj = Sheets(sht0.Cells(2, 4 + cnt).Value).ChartObjects(sht0.Cells(3, 4 + cnt).Value)

        ' グラフの設定を書き込むサブルーチンを呼び出す
        Call writeChartSetting(chartObj, cnt)

    Next cnt

End Sub
Sub ImportGraphSettingFromSheets()
    'サブルーチンは、ワークシートからグラフの設定をインポートします。

    Dim sht0 As Worksheet ' グラフ管理用ワークシート
    Dim sht As Worksheet ' 処理中のワークシート
    Dim cnt As Long ' 設定のカウンター
    Dim chartObj As Variant ' グラフオブジェクト
    Dim obj As Variant ' 図形用のVariant
    Dim grp As Variant ' 図形のグループ用のVariant

    ' グラフ管理シートを設定
    Set sht0 = Sheets("グラフ管理")

    ' 前回のグラフ設定をクリア
    sht0.Range(sht0.Range("D2:D100"), sht0.Range("D2:D100").End(xlToRight)).ClearContents

    ' カウンターを初期化
    cnt = 0

    ' ワークブック内のすべてのワークシートをループ
    For Each sht In ThisWorkbook.Worksheets

        ' ワークシート内のすべての図形をループ
        For Each obj In sht.Shapes

            ' 図形がグループの場合
            If obj.Type = msoGroup Then

                ' グループ内のすべてのアイテムをループ
                For Each grp In obj.GroupItems

                    ' グループ内のアイテムがグラフの場合
                    If grp.Type = msoChart Then

                        ' グラフオブジェクトを設定
                        Set chartObj = grp
                        ' グラフの設定を読み込む
                        Call readChartSetting(chartObj, cnt)
                        ' シート名を管理シートに書き込む
                        sht0.Cells(2, 4 + cnt) = sht.Name
                        ' カウンターをインクリメント
                        cnt = cnt + 1

                    End If

                Next grp

            End If

            ' 図形がグラフの場合
            If obj.Type = msoChart Then

                ' グラフオブジェクトを設定
                Set chartObj = obj
                ' グラフの設定を読み込む
                Call readChartSetting(chartObj, cnt)
                ' シート名を管理シートに書き込む
                sht0.Cells(2, 4 + cnt) = sht.Name
                ' カウンターをインクリメント
                cnt = cnt + 1

            End If

        Next obj

    Next sht

End Sub

Sub writeChartSetting(chartObj As Variant, cnt As Long)
    ' writeChartSettingサブルーチンは、"グラフ管理"シートの値に基づいてグラフの設定を書き込みます。

    Dim sht0 As Worksheet ' グラフ管理用ワークシート
    Set sht0 = Sheets("グラフ管理") ' グラフ管理用ワークシートを設定

    ' グラフオブジェクトに設定を適用する
    With chartObj.Chart

        ' グラフの高さと幅を設定(cm単位)
        .Parent.Height = sht0.Cells(5, 4 + cnt) * CmToPT '[cm]
        .Parent.Width = sht0.Cells(6, 4 + cnt) * CmToPT '[cm]

        ' グラフエリアのフォントサイズを設定
        .ChartArea.Font.Size = sht0.Cells(7, 4 + cnt)

        ' グラフタイトルが存在する場合は設定
        .HasTitle = (sht0.Cells(8, 4 + cnt) <> False)
        If .HasTitle Then
            .ChartTitle.Caption = sht0.Cells(8, 4 + cnt)
            .ChartTitle.Top = sht0.Cells(11, 4 + cnt) * CmToPT '[cm]
            .ChartTitle.Left = sht0.Cells(12, 4 + cnt) * CmToPT '[cm]
        End If

        ' プロットエリアの高さ、幅、位置を設定
        .PlotArea.Height = sht0.Cells(13, 4 + cnt) * CmToPT '[cm]
        .PlotArea.Width = sht0.Cells(14, 4 + cnt) * CmToPT '[cm]
        .PlotArea.Top = sht0.Cells(15, 4 + cnt) * CmToPT '[cm]
        .PlotArea.Left = sht0.Cells(16, 4 + cnt) * CmToPT '[cm]

        ' 値軸のプロパティを設定
        .Axes(xlValue, 1).HasTitle = (sht0.Cells(17, 4 + cnt) <> False)
        If .Axes(xlValue, 1).HasTitle Then .Axes(xlValue, 1).AxisTitle.Text = sht0.Cells(17, 4 + cnt)
        .Axes(xlValue).MaximumScale = sht0.Cells(18, 4 + cnt)
        .Axes(xlValue).MinimumScale = sht0.Cells(19, 4 + cnt)
        .Axes(xlValue, 1).HasMajorGridlines = (sht0.Cells(20, 4 + cnt) <> False)
        If .Axes(xlValue, 1).HasMajorGridlines Then .Axes(xlValue).MajorUnit = sht0.Cells(20, 4 + cnt)
        .Axes(xlValue, 1).HasMinorGridlines = (sht0.Cells(21, 4 + cnt) <> False)
        If .Axes(xlValue, 1).HasMinorGridlines Then .Axes(xlValue).MinorUnit = sht0.Cells(21, 4 + cnt)
        .Axes(xlValue).TickLabels.NumberFormatLocal = sht0.Cells(22, 4 + cnt)

        ' カテゴリ軸のプロパティを設定
        .Axes(xlCategory, 1).HasTitle = (sht0.Cells(23, 4 + cnt) <> False)
        If .Axes(xlCategory, 1).HasTitle Then .Axes(xlCategory, 1).AxisTitle.Text = sht0.Cells(23, 4 + cnt)
        .Axes(xlCategory).MaximumScale = sht0.Cells(24, 4 + cnt)
        .Axes(xlCategory).MinimumScale = sht0.Cells(25, 4 + cnt)
        .Axes(xlCategory, 1).HasMajorGridlines = (sht0.Cells(26, 4 + cnt) <> False)
        If .Axes(xlCategory, 1).HasMajorGridlines Then .Axes(xlCategory).MajorUnit = sht0.Cells(26, 4 + cnt)
        .Axes(xlCategory, 1).HasMinorGridlines = (sht0.Cells(27, 4 + cnt) <> False)
        If .Axes(xlCategory, 1).HasMinorGridlines Then .Axes(xlCategory).MinorUnit = sht0.Cells(27, 4 + cnt)
        .Axes(xlCategory).TickLabels.NumberFormatLocal = sht0.Cells(28, 4 + cnt)

        ' 凡例のプロパティを設定
        .HasLegend = sht0.Cells(29, 4 + cnt)
        If .HasLegend Then
            .Legend.Height = sht0.Cells(30, 4 + cnt) * CmToPT '[cm]
            .Legend.Width = sht0.Cells(31, 4 + cnt) * CmToPT '[cm]
            .Legend.Top = sht0.Cells(32, 4 + cnt) * CmToPT '[cm]
            .Legend.Left = sht0.Cells(33, 4 + cnt) * CmToPT '[cm]
            .Legend.Format.Fill.Visible = sht0.Cells(34, 4 + cnt)
            .Legend.Format.Line.Visible = sht0.Cells(35, 4 + cnt)
        End If

        ' シリーズデータを設定
        For i = 1 To sht0.Cells(36, 4 + cnt)
            If i > .SeriesCollection.Count Then ActiveChart.SeriesCollection.NewSeries
            .FullSeriesCollection(i).Formula = "=SERIES(" & sht0.Cells(37 + (i - 1) * 3, 4 + cnt) & "," & sht0.Cells(38 + (i - 1) * 3, 4 + cnt) & "," & sht0.Cells(39 + (i - 1) * 3, 4 + cnt) & "," & i & ")"
        Next i
        Do While .SeriesCollection.Count > sht0.Cells(36, 4 + cnt)
            ActiveChart.FullSeriesCollection(.SeriesCollection.Count).Delete
        Loop

    End With

End Sub

Sub readChartSetting(chartObj As Variant, cnt As Long)
    ' readChartSettingサブルーチンは、"グラフ管理"シートからグラフの設定を読み込みます。

    Dim sht0 As Worksheet ' グラフ管理用ワークシート
    Set sht0 = Sheets("グラフ管理") ' グラフ管理用ワークシートを設定

    ' グラフオブジェクトの設定を読み取り、"グラフ管理"シートに書き込む
    With chartObj.Chart

        ' グラフのインデックスと名前を書き込む
        sht0.Cells(3, 4 + cnt) = .Parent.Index
        sht0.Cells(4, 4 + cnt) = .Parent.Name

        ' グラフの高さ、幅、フォントサイズを書き込む
        sht0.Cells(5, 4 + cnt) = .Parent.Height / CmToPT '[cm]
        sht0.Cells(6, 4 + cnt) = .Parent.Width / CmToPT '[cm]
        sht0.Cells(7, 4 + cnt) = .ChartArea.Font.Size

        ' グラフタイトルが存在する場合はその設定を書き込む
        If .HasTitle Then
            sht0.Cells(8, 4 + cnt) = .ChartTitle.Caption
            sht0.Cells(9, 4 + cnt) = .ChartTitle.Height / CmToPT '[cm]
            sht0.Cells(10, 4 + cnt) = .ChartTitle.Width / CmToPT '[cm]
            sht0.Cells(11, 4 + cnt) = .ChartTitle.Top / CmToPT '[cm]
            sht0.Cells(12, 4 + cnt) = .ChartTitle.Left / CmToPT '[cm]
        Else
            sht0.Cells(8, 4 + cnt) = .HasTitle
        End If

        ' プロットエリアの設定を書き込む
        sht0.Cells(13, 4 + cnt) = .PlotArea.Height / CmToPT '[cm]
        sht0.Cells(14, 4 + cnt) = .PlotArea.Width / CmToPT '[cm]
        sht0.Cells(15, 4 + cnt) = .PlotArea.Top / CmToPT '[cm]
        sht0.Cells(16, 4 + cnt) = .PlotArea.Left / CmToPT '[cm]

        ' 値軸の設定を書き込む
        If .Axes(xlValue, 1).HasTitle Then
            sht0.Cells(17, 4 + cnt) = .Axes(xlValue, 1).AxisTitle.Text
        Else
            sht0.Cells(17, 4 + cnt) = .Axes(xlValue, 1).HasTitle
        End If
        sht0.Cells(18, 4 + cnt) = .Axes(xlValue).MaximumScale
        sht0.Cells(19, 4 + cnt) = .Axes(xlValue).MinimumScale
        If .Axes(xlValue, 1).HasMajorGridlines Then
            sht0.Cells(20, 4 + cnt) = .Axes(xlValue).MajorUnit
        Else
            sht0.Cells(20, 4 + cnt) = .Axes(xlValue, 1).HasMajorGridlines
        End If
        If .Axes(xlValue, 1).HasMinorGridlines Then
            sht0.Cells(21, 4 + cnt) = .Axes(xlValue).MinorUnit
        Else
            sht0.Cells(21, 4 + cnt) = .Axes(xlValue, 1).HasMinorGridlines
        End If
        sht0.Cells(22, 4 + cnt) = .Axes(xlValue).TickLabels.NumberFormatLocal

        ' カテゴリ軸の設定を書き込む
        If .Axes(xlCategory, 1).HasTitle Then
            sht0.Cells(23, 4 + cnt) = .Axes(xlCategory, 1).AxisTitle.Text
        Else
            sht0.Cells(23, 4 + cnt) = .Axes(xlCategory, 1).HasTitle
        End If
        sht0.Cells(24, 4 + cnt) = .Axes(xlCategory).MaximumScale
        sht0.Cells(25, 4 + cnt) = .Axes(xlCategory).MinimumScale
        If .Axes(xlCategory, 1).HasMajorGridlines Then
            sht0.Cells(26, 4 + cnt) = .Axes(xlCategory).MajorUnit
        Else
            sht0.Cells(26, 4 + cnt) = .Axes(xlCategory, 1).HasMajorGridlines
        End If
        If .Axes(xlCategory, 1).HasMinorGridlines Then
            sht0.Cells(27, 4 + cnt) = .Axes(xlCategory).MinorUnit
        Else
            sht0.Cells(27, 4 + cnt) = .Axes(xlCategory, 1).HasMinorGridlines
        End If
        sht0.Cells(28, 4 + cnt) = .Axes(xlValue).TickLabels.NumberFormatLocal

        ' 凡例の設定を書き込む
        sht0.Cells(29, 4 + cnt) = .HasLegend
        If .HasLegend Then
            sht0.Cells(30, 4 + cnt) = .Legend.Height / CmToPT '[cm]
            sht0.Cells(31, 4 + cnt) = .Legend.Width / CmToPT '[cm]
            sht0.Cells(32, 4 + cnt) = .Legend.Top / CmToPT '[cm]
            sht0.Cells(33, 4 + cnt) = .Legend.Left / CmToPT '[cm]
            sht0.Cells(34, 4 + cnt) = .Legend.Format.Fill.Visible
            sht0.Cells(35, 4 + cnt) = .Legend.Format.Line.Visible
        End If

        ' シリーズデータの設定を書き込む
        sht0.Cells(36, 4 + cnt) = .SeriesCollection.Count
        For i = 1 To .SeriesCollection.Count
            sht0.Cells(37 + (i - 1) * 3, 4 + cnt) = Split(Split(.SeriesCollection(i).Formula, "(")(1), ",")(0)
            sht0.Cells(38 + (i - 1) * 3, 4 + cnt) = Split(Split(.SeriesCollection(i).Formula, "(")(1), ",")(1)
            sht0.Cells(39 + (i - 1) * 3, 4 + cnt) = Split(Split(.SeriesCollection(i).Formula, "(")(1), ",")(2)
        Next i

    End With

End Sub
使い方
このプログラムを実行したいエクセルファイル(.xlsm)に「グラフ管理」というシートを追加し、B列とC列の2行目以降に以下の項目をコピペする
| シート名 | |
| ID | |
| グラフ名 | |
| グラフ高さ [cm] | |
| グラフ幅 [cm] | |
| フォントサイズ | |
| グラフタイトル | テキスト |
| 高さ | |
| 幅 | |
| 上位置 | |
| 左位置 | |
| プロットエリア | 高さ |
| 幅 | |
| 上位置 | |
| 左位置 | |
| 縦軸 | 軸ラベル |
| 最大値 | |
| 最小値 | |
| 主 | |
| 補助 | |
| 書式 | |
| 横軸 | 軸ラベル |
| 最大値 | |
| 最小値 | |
| 主 | |
| 補助 | |
| 書式 | |
| 凡例 | 表示 |
| 高さ | |
| 幅 | |
| 上位置 | |
| 左位置 | |
| 塗りつぶし | |
| 枠線 | |
| 系列数 | |
| 系列1 | 系列名 |
| Xの値 | |
| Yの値 | |
| 系列2 | 系列名 |
| Xの値 | |
| Yの値 | |
| 系列3 | 系列名 |
| Xの値 | |
| Yの値 | |
Alt+F8でマクロのウィンドウを開き、「ImportGraphSettingFromSheets」を実行する
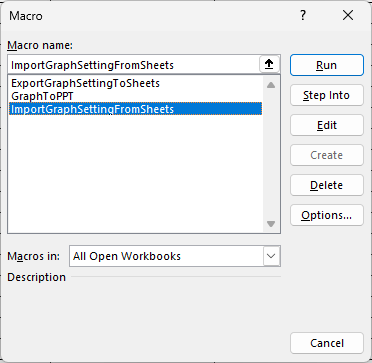
グラフの設定が読み込まれる

設定を変更したら、再びAlt+F8でマクロのウィンドウを開き、今度は「ExportGraphSettingToSheets」を実行する
これで設定の変更がすべてのグラフに反映される
以上
おわりに
シートにある全グラフの設定を取得し、変更を加えてから更新するマクロを作成したので紹介した
エクセルの体裁を整えるのは地味に重要かつ非常に面倒な作業なので、このマクロを使えばかなり時間と手間を節約できる
設定の項目を増やしたい場合は、適宜行を追加し、マクロを書き換えてほしい
↓関連記事


コメント