翼型の圧力分布を理解するために、いろいろな翼型の圧力分布を紹介する
はじめに
翼型の圧力分布を理解するために、圧力分布の基本といろいろな翼型の圧力分布を紹介する
↓翼型の基本についてはこちら(他サイト)
翼型の形状定義 ー 翼型の形状を決める2つのパラメータ(翼厚とキャンバー) | 鳩ぽっぽ
↓圧力分布の可視化はXFOILを使用し、流線の可視化は境界要素法を使用した
実際に使ったExcelマクロのダウンロードはこの記事の一番最後で
参考文献
↓ポテンシャル流れ/粘性流れ
Investigation of low-speed turbulent separated flow around airfoils - NASA Technical Reports Server (NTRS)
Described is a low-speed wind tunnel experiment to measure the flowfield around a two-dimensional airfoil operating clos...
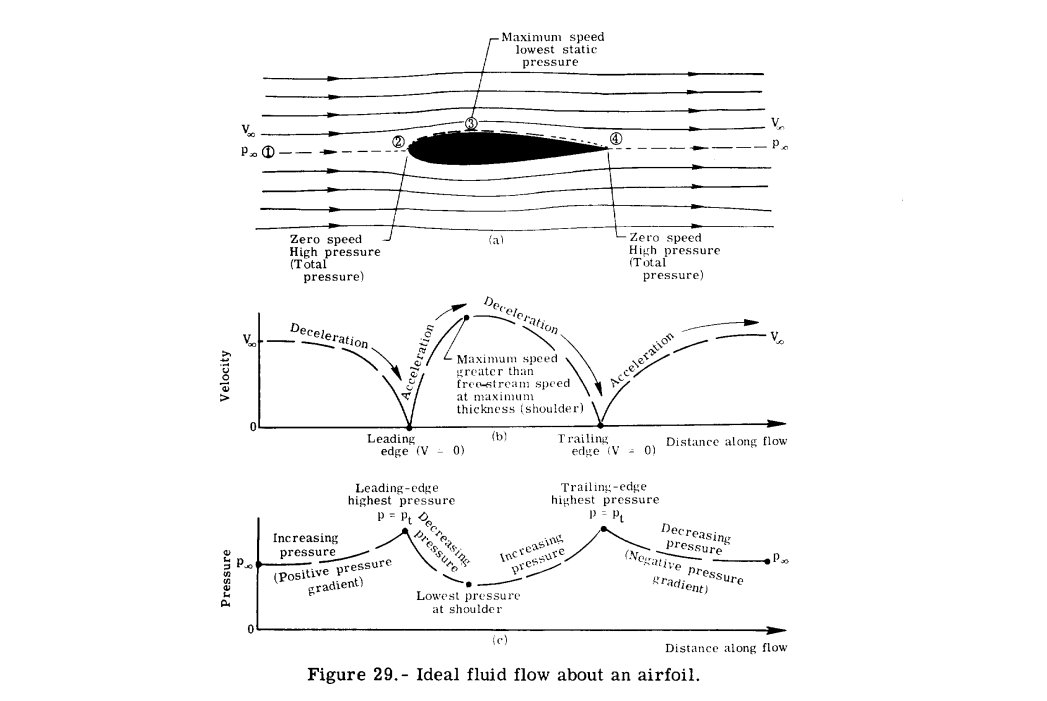
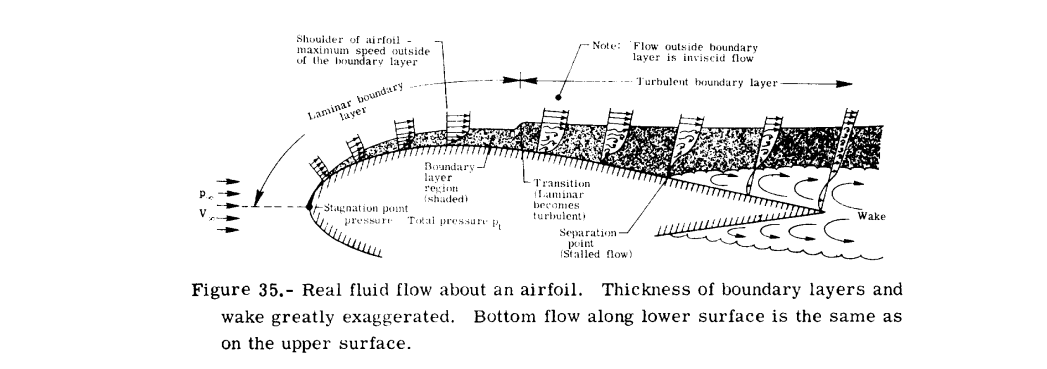
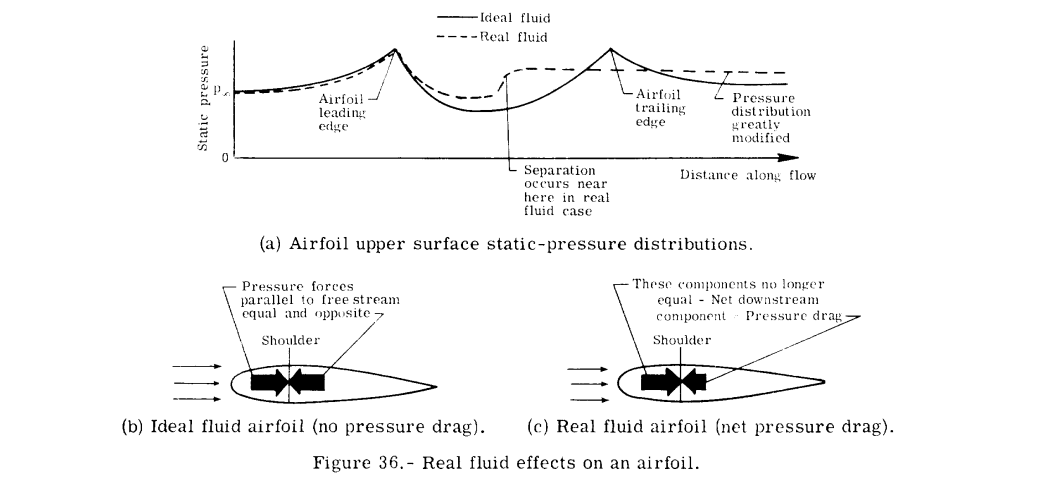
↓低レイノルズ数流れ/境界層剥離
Experimental measurements of the laminar separation bubble on an Eppler 387 airfoil at low Reynolds numbers - NASA Technical Reports Server (NTRS)
An experimental investigation was conducted to measure the flow velocity in the boundary layer of an Eppler 387 airfoil....
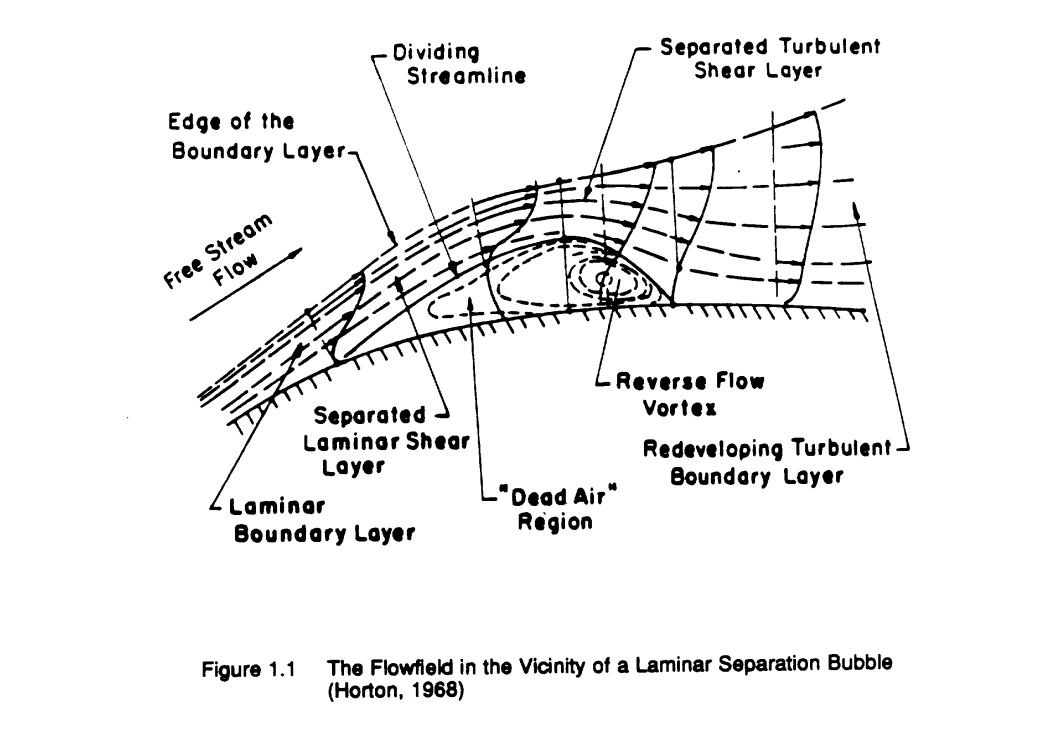
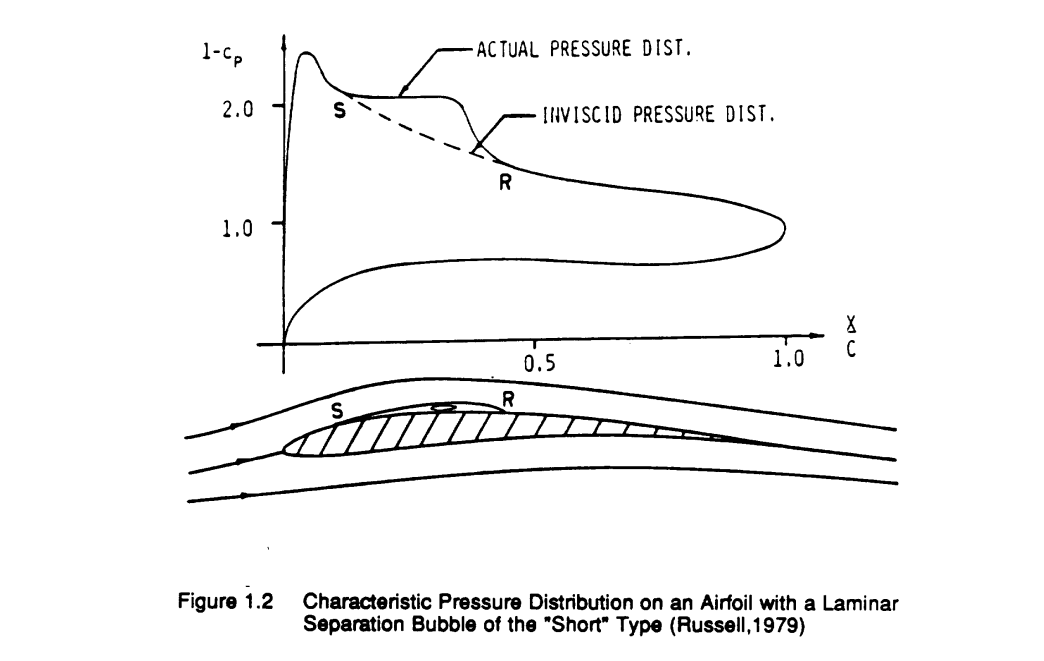
↓超臨界翼
NASA supercritical airfoils: A matrix of family-related airfoils - NASA Technical Reports Server (NTRS)
The NASA supercritical airfoil development program is summarized in a chronological fashion. Some of the airfoil design ...
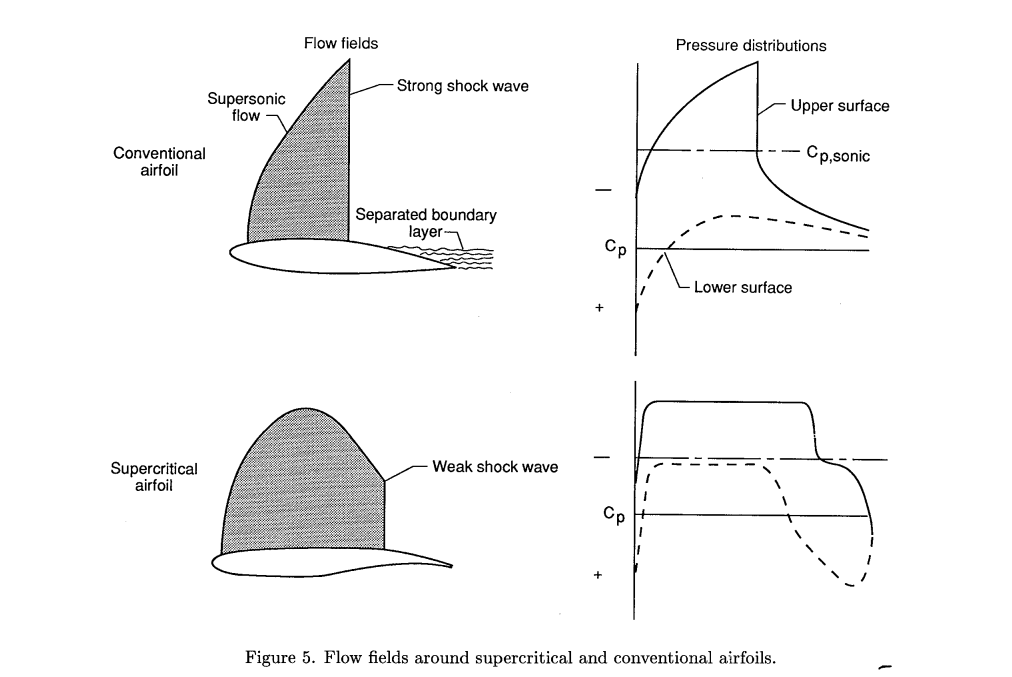
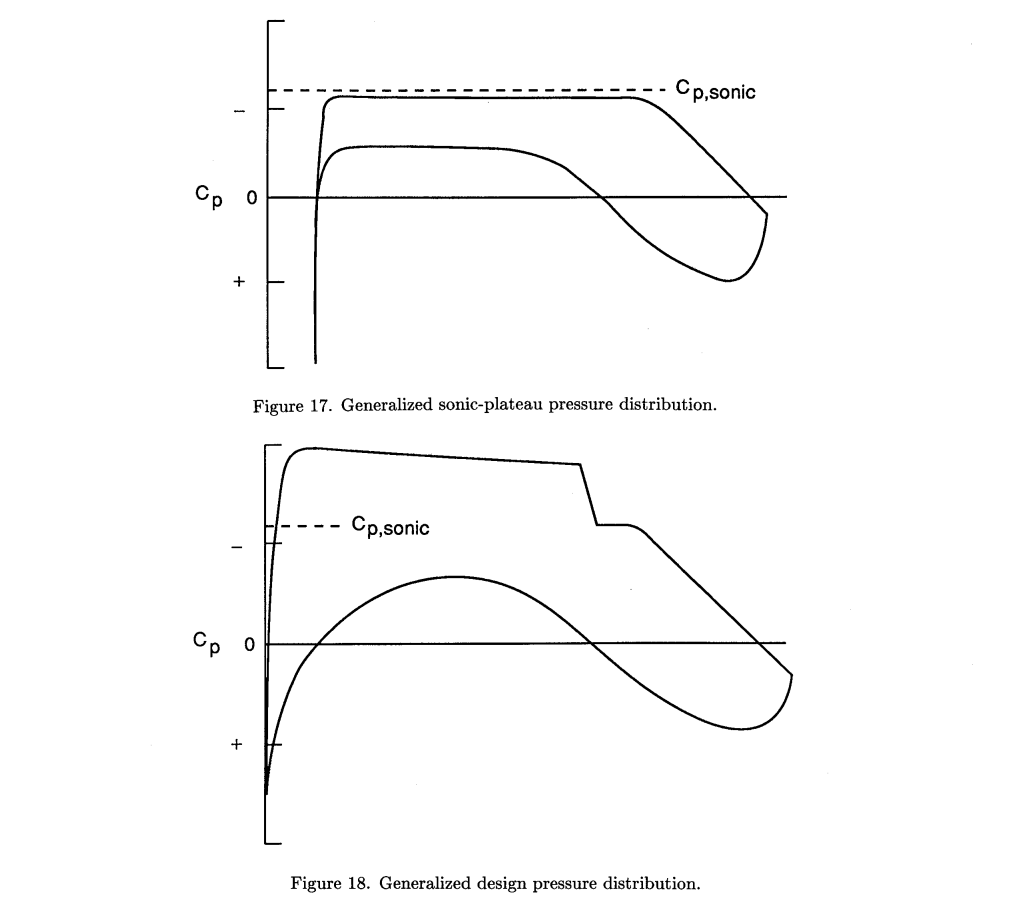
対称翼(NACA0012)
XFOIL解析条件
- Re=1E7
- Mach=0
- xtr=(0,0) ※前縁で強制遷移
ゼロ揚力角
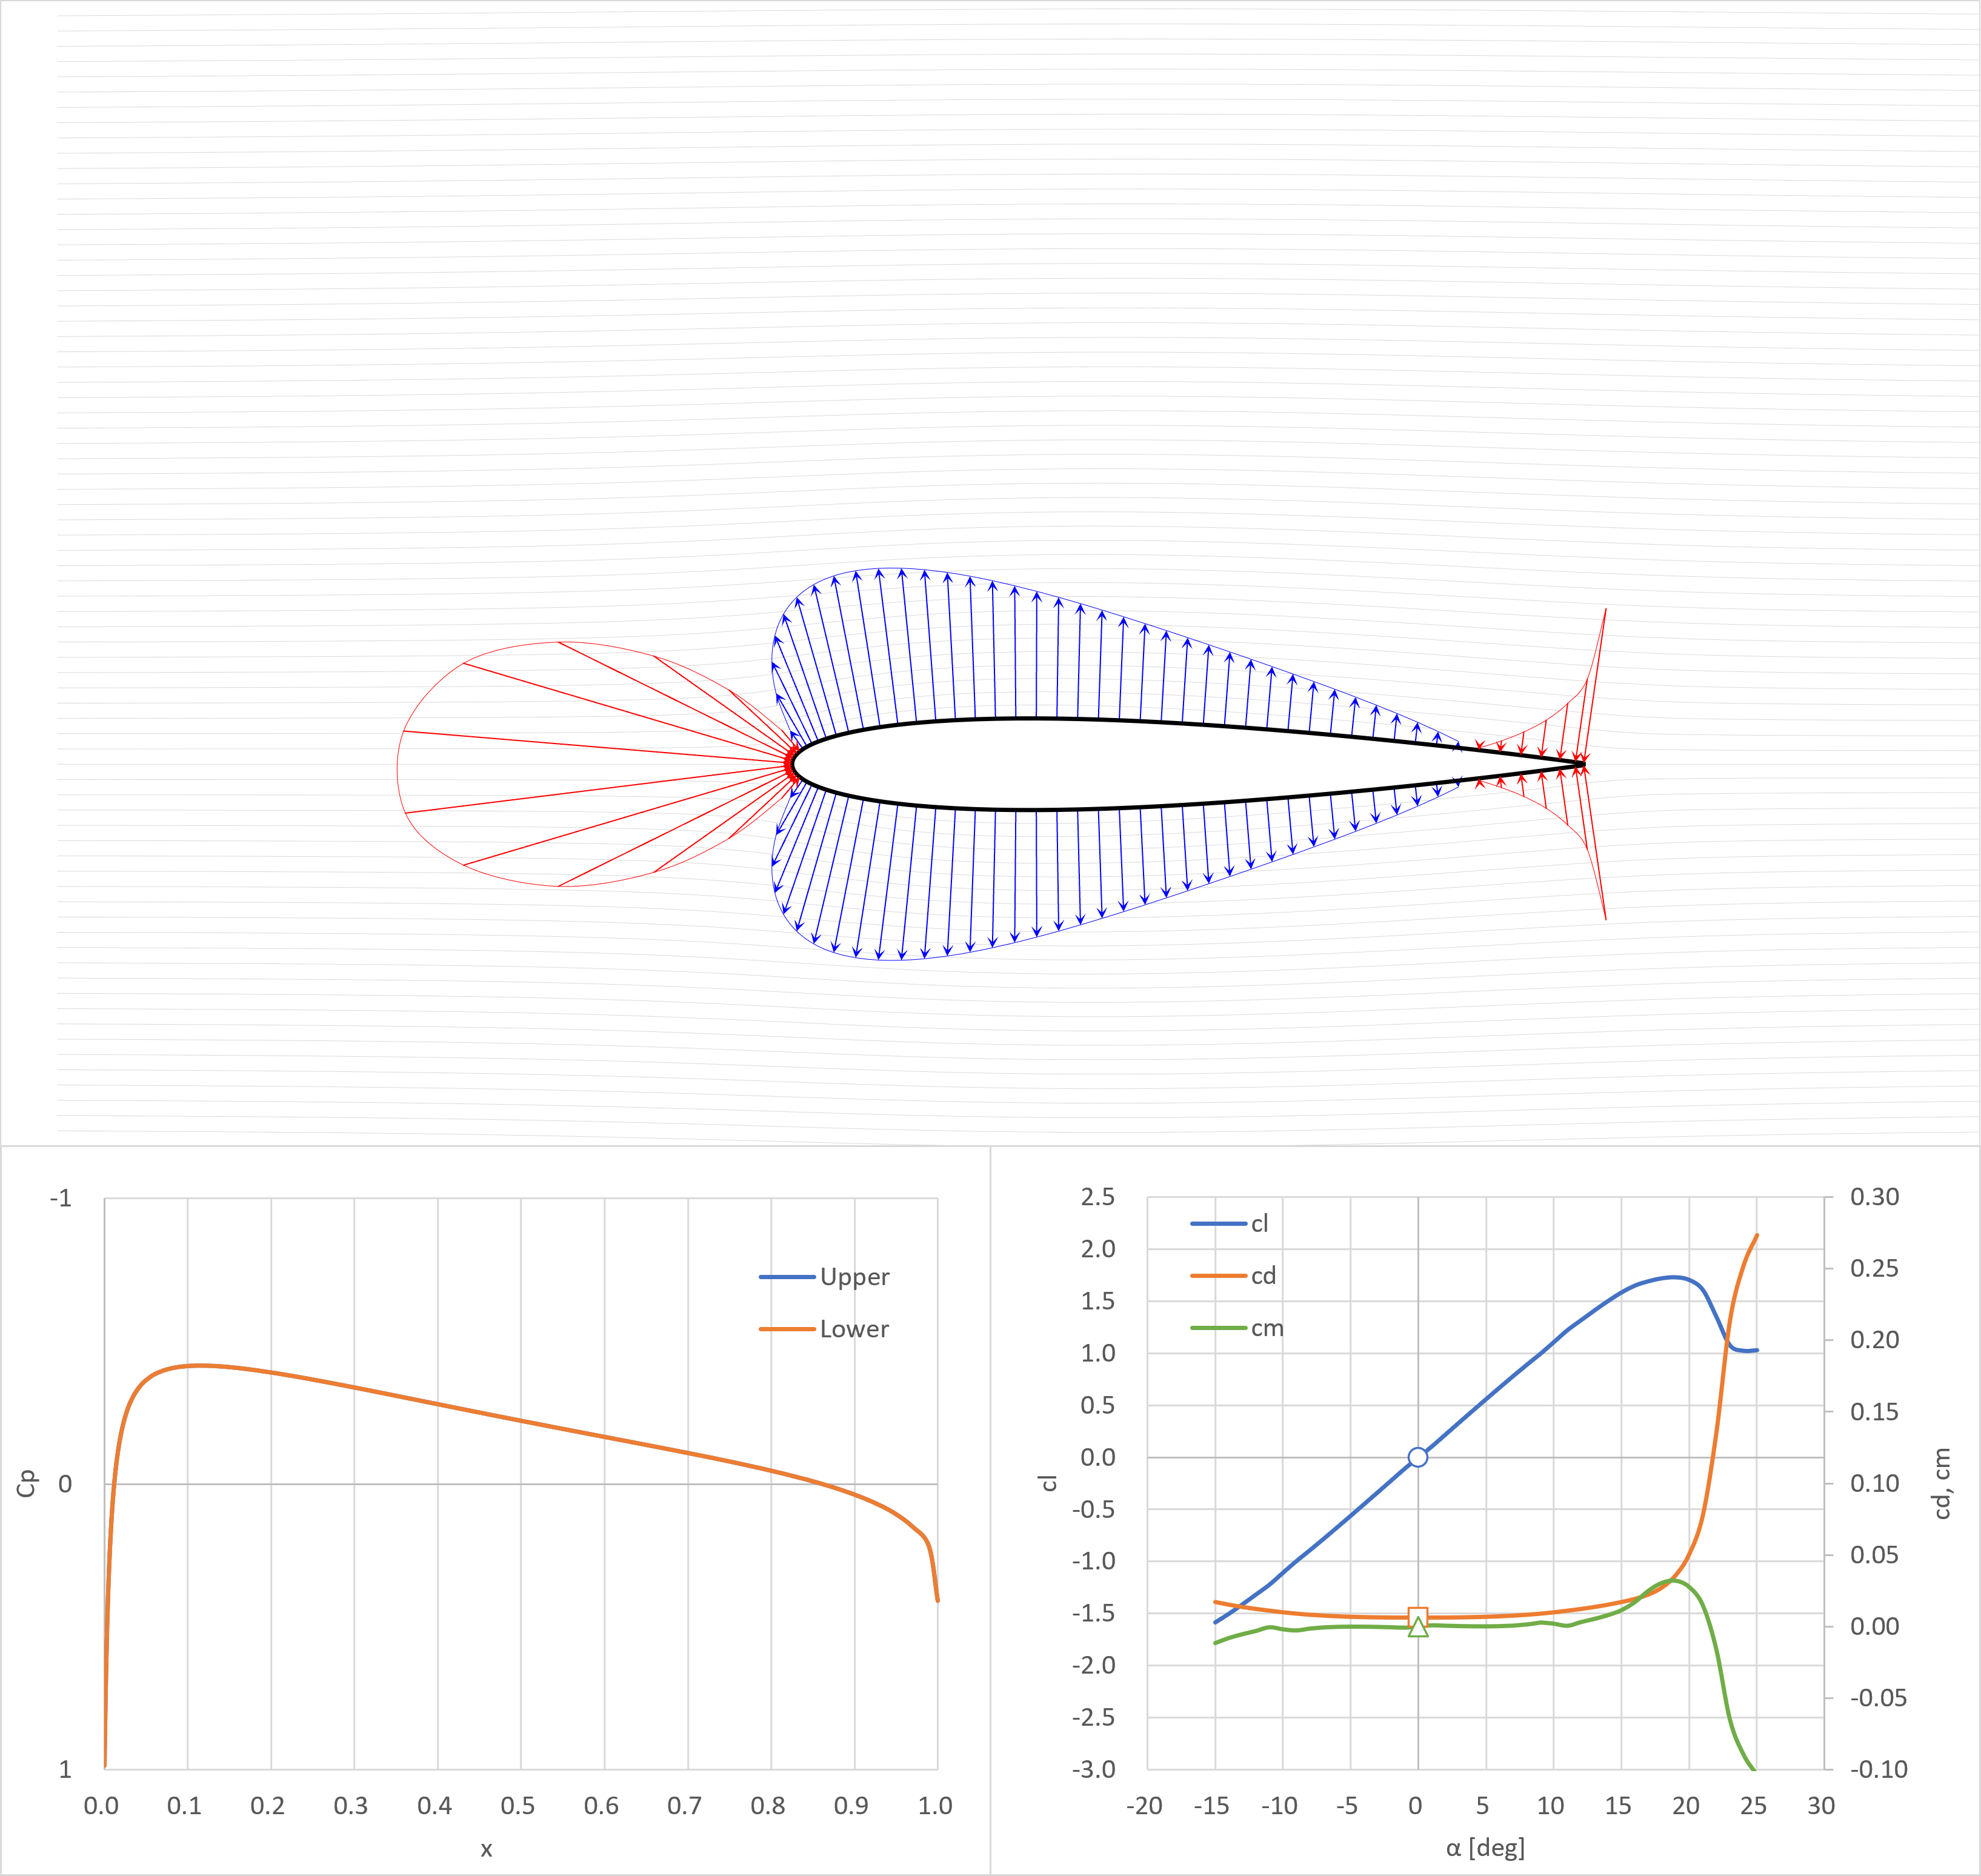
- 上下対象の圧力分布
- 後縁のCp=0.409
cl=0.5
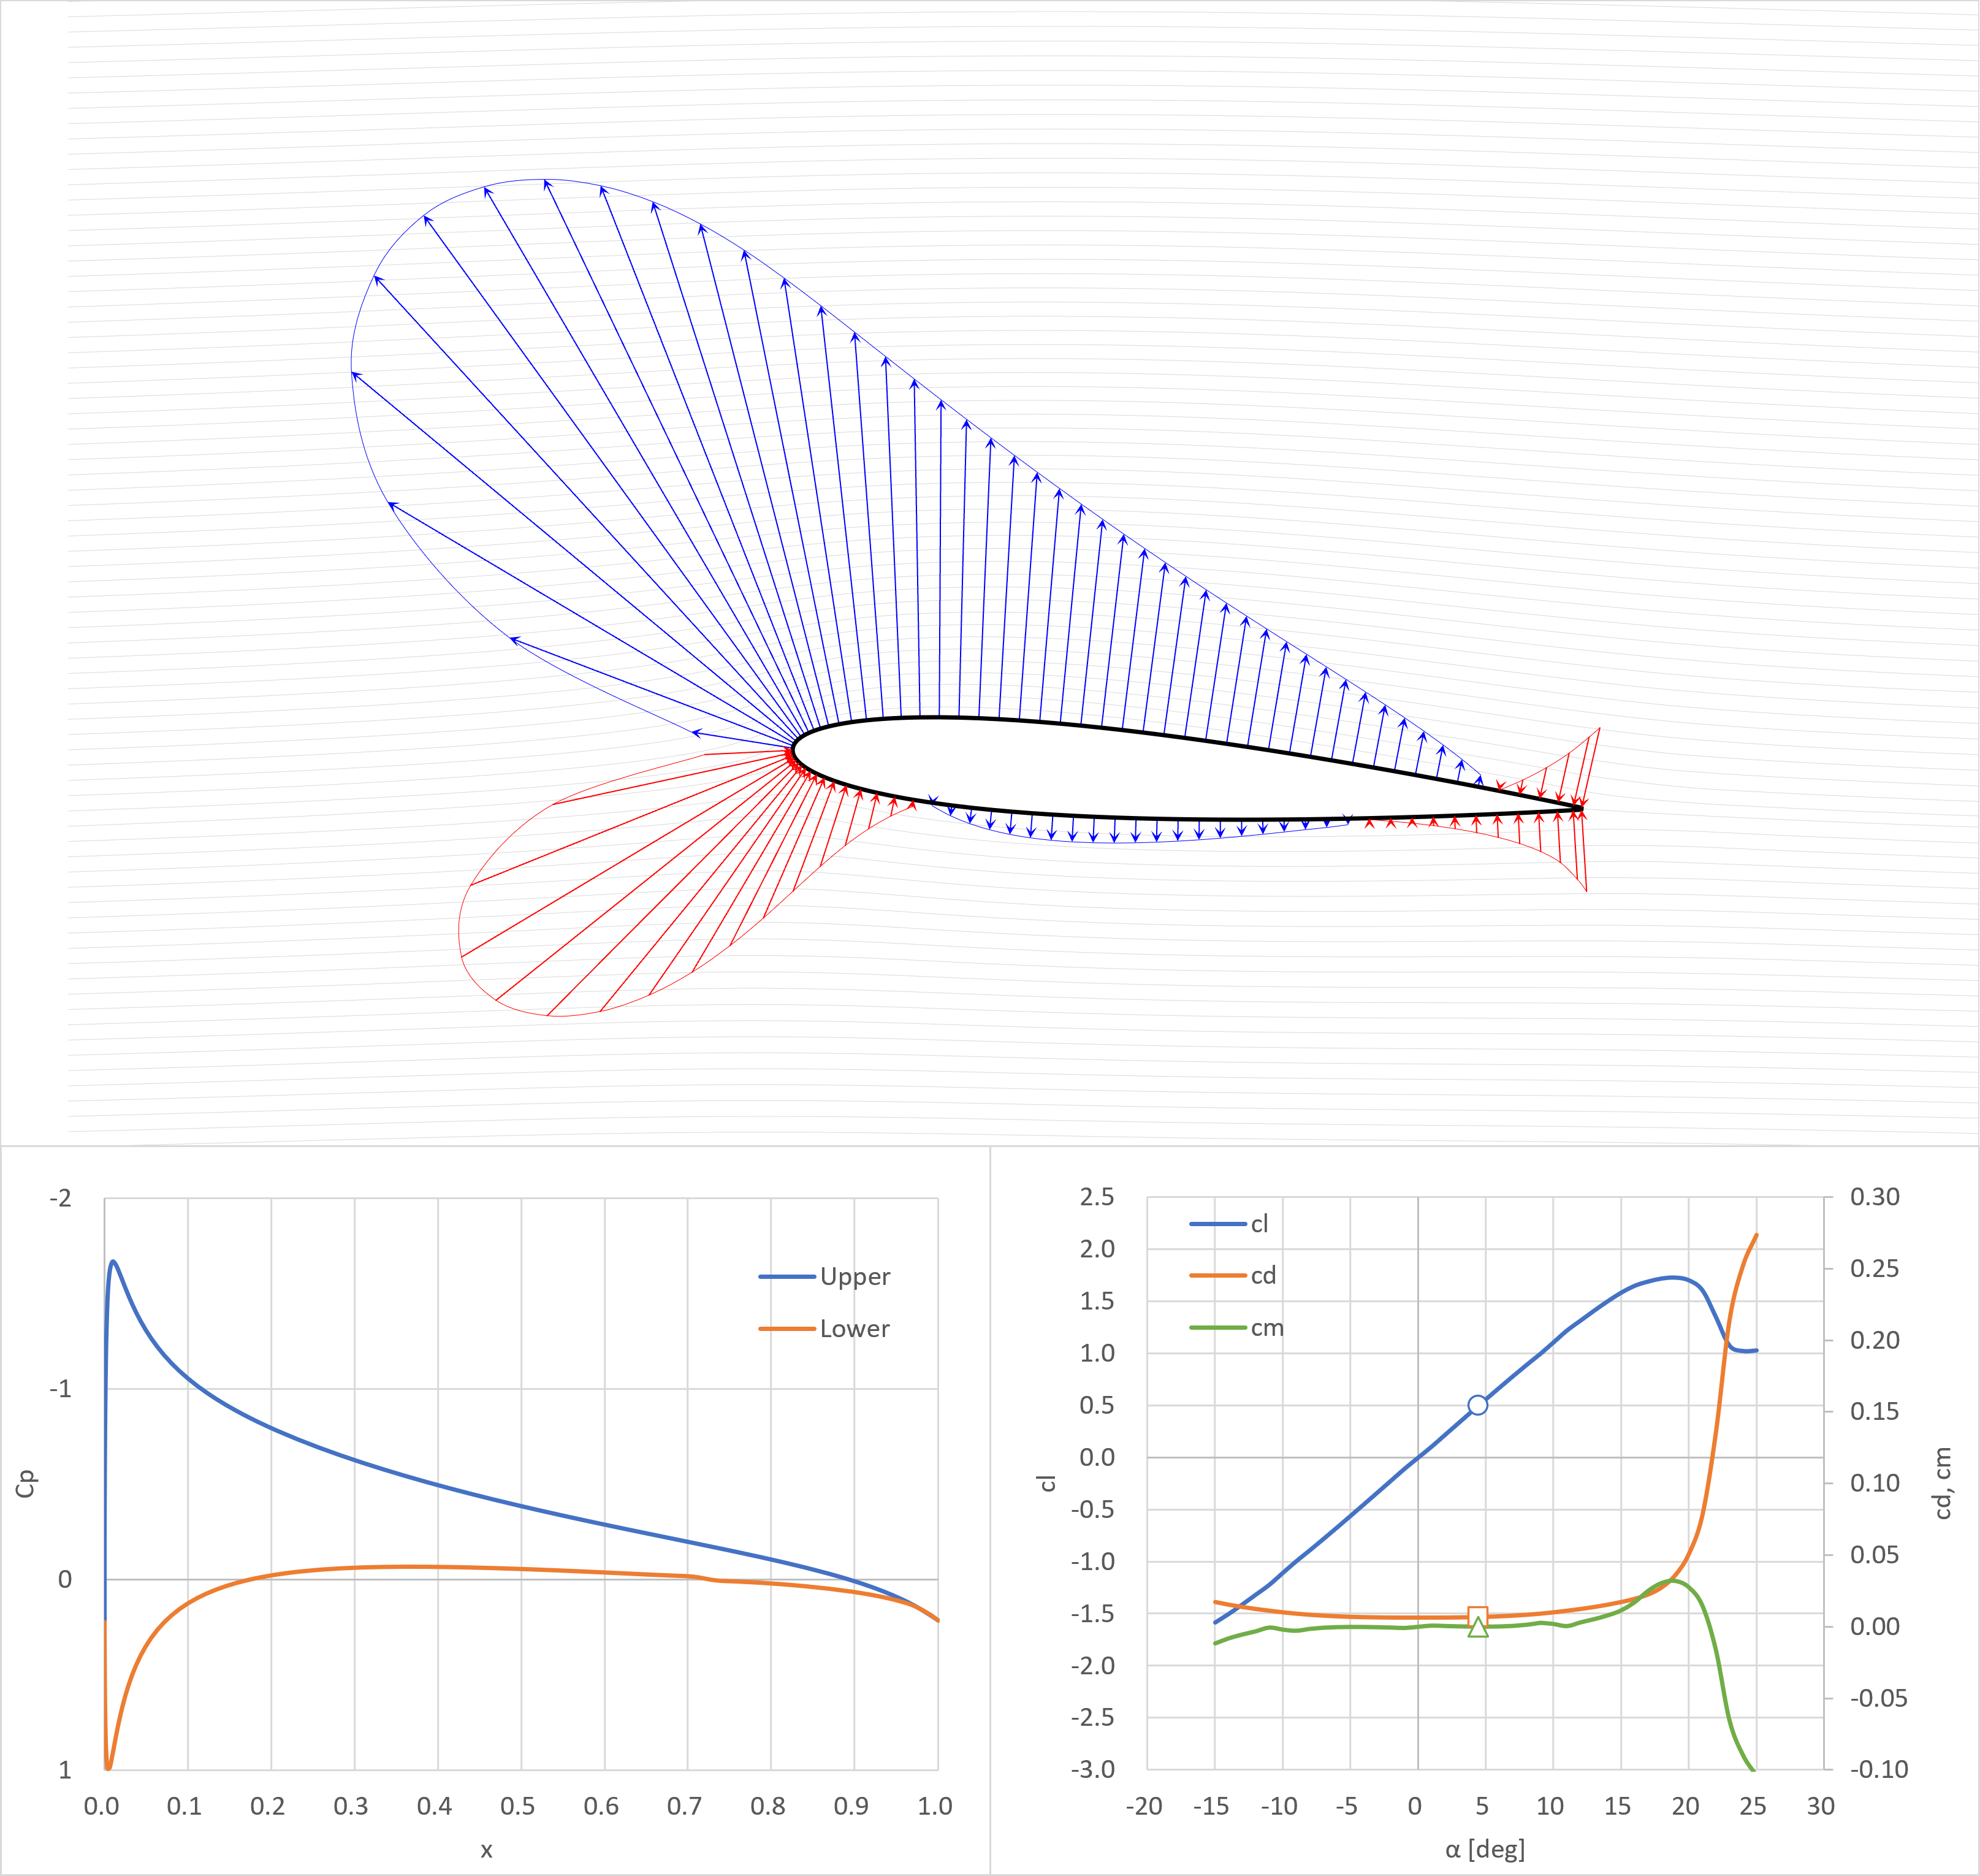
cl=1.0
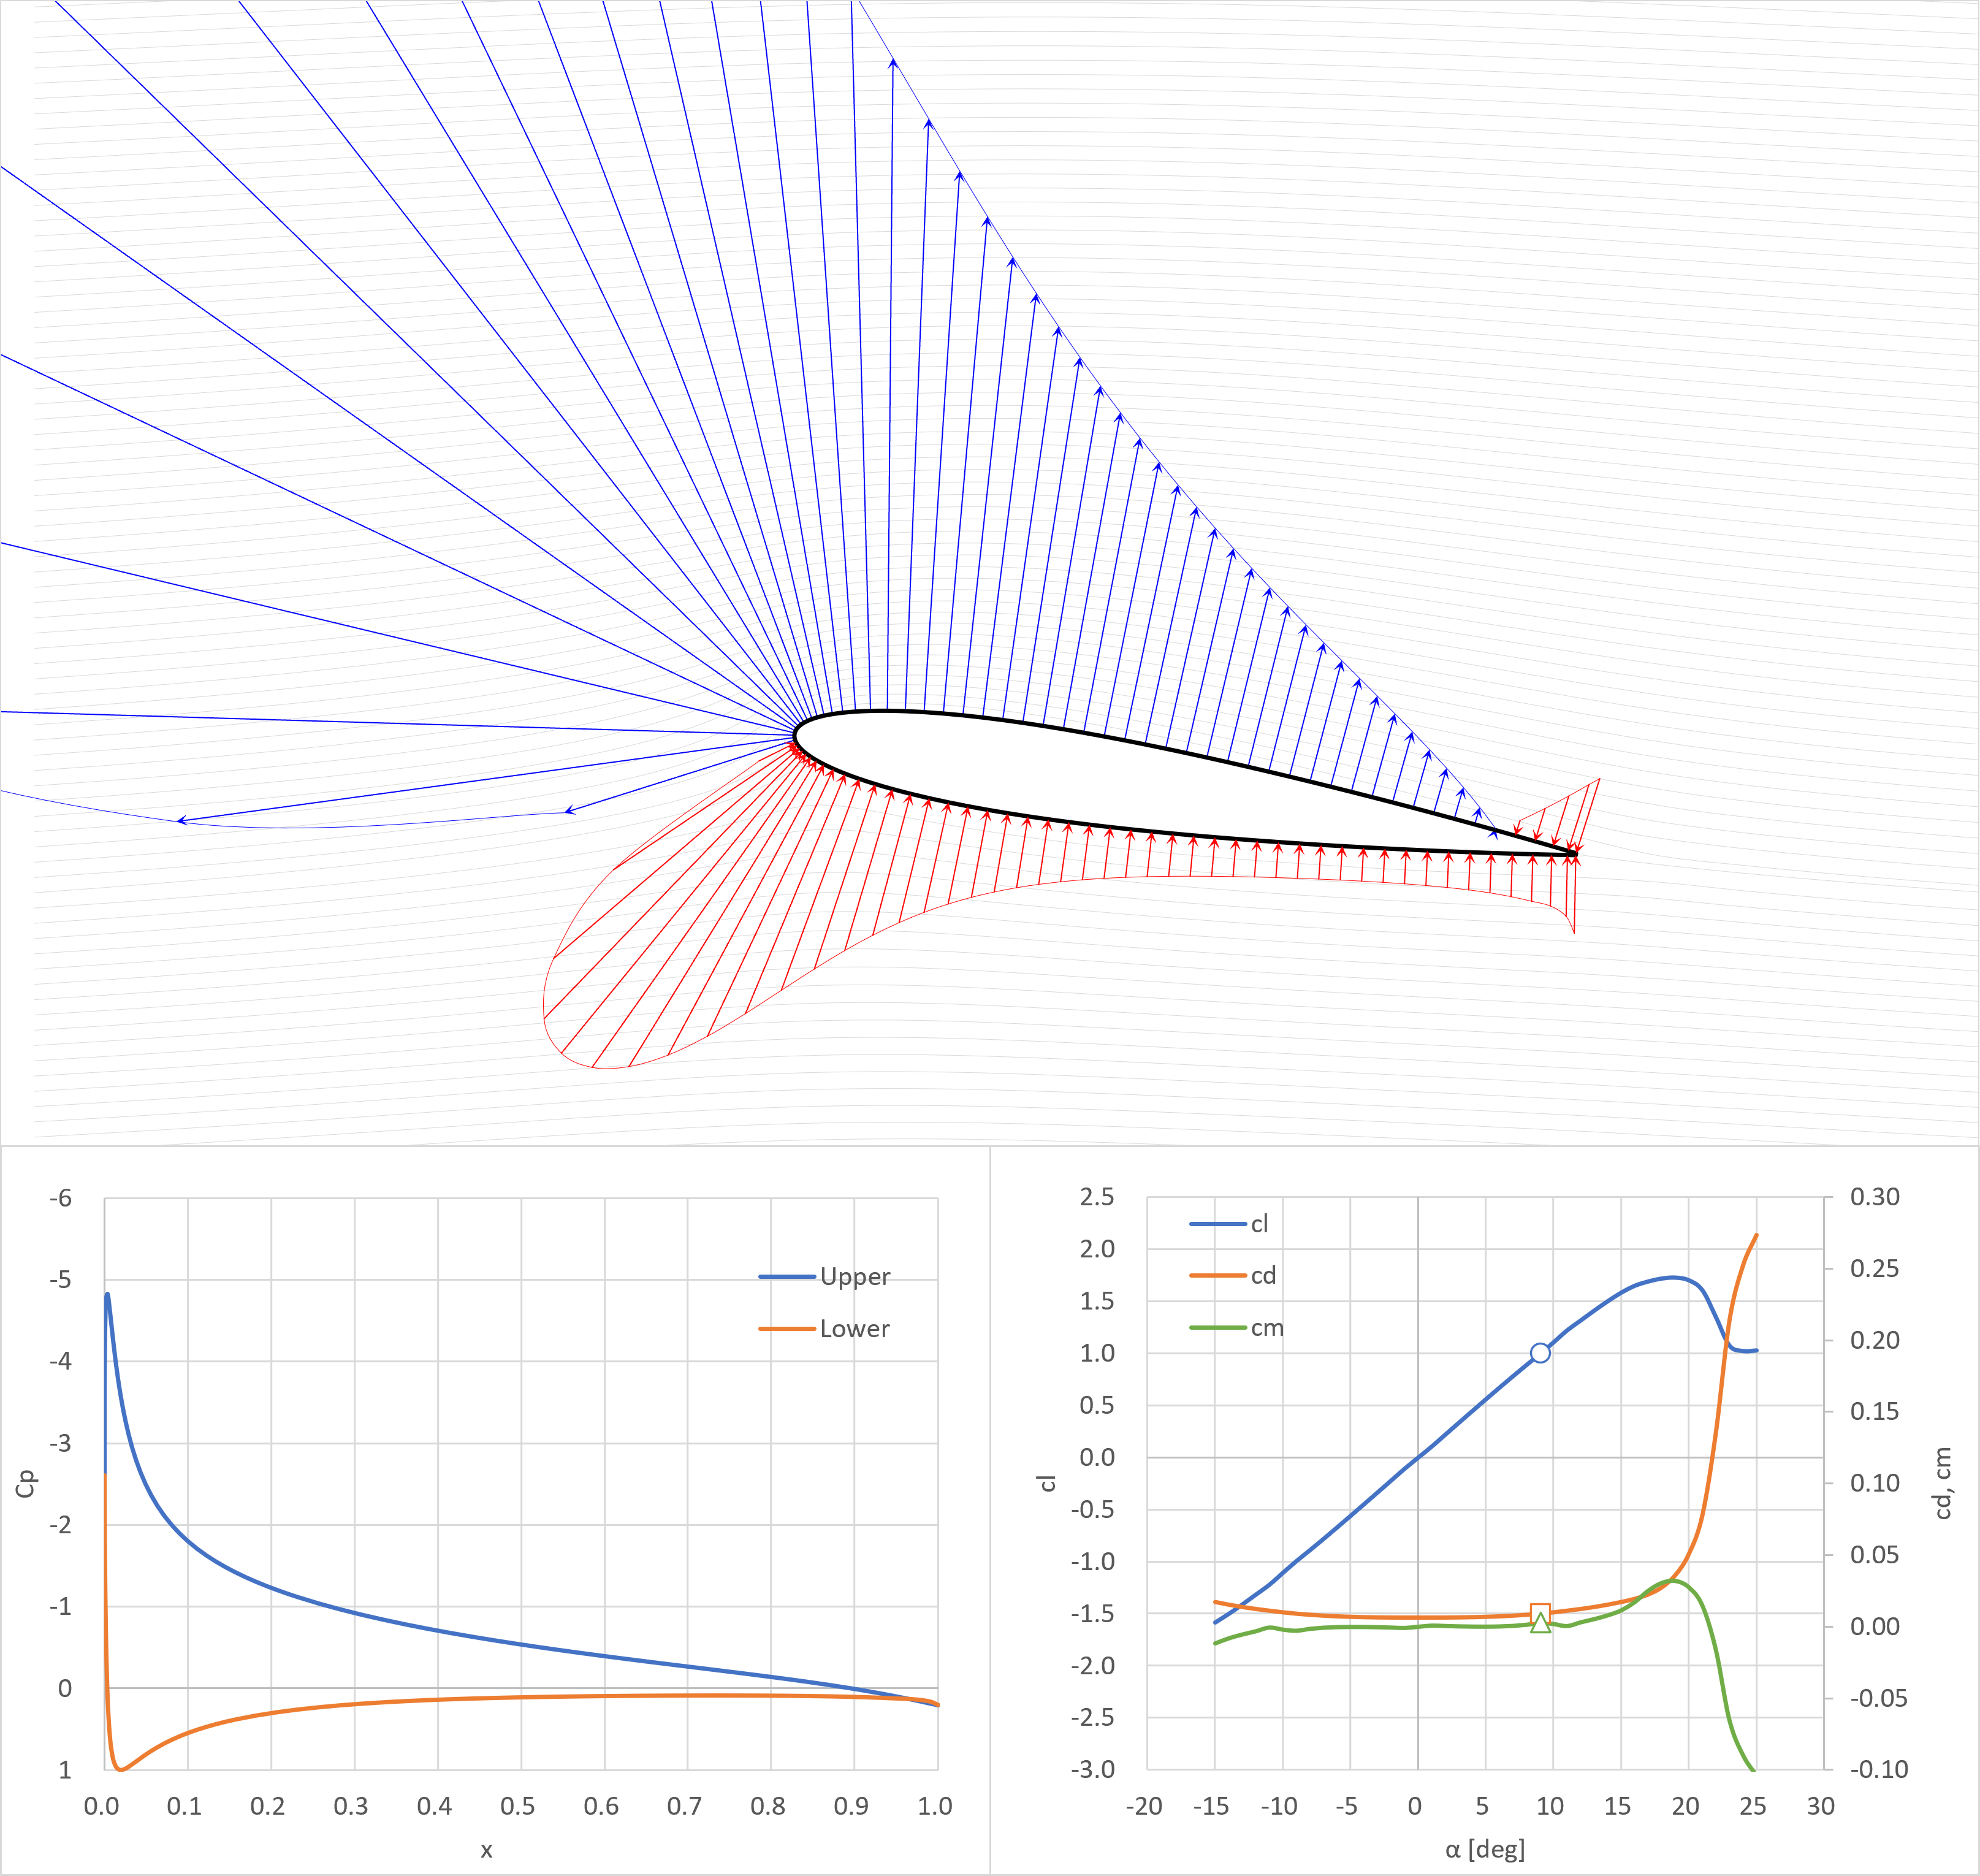
失速角
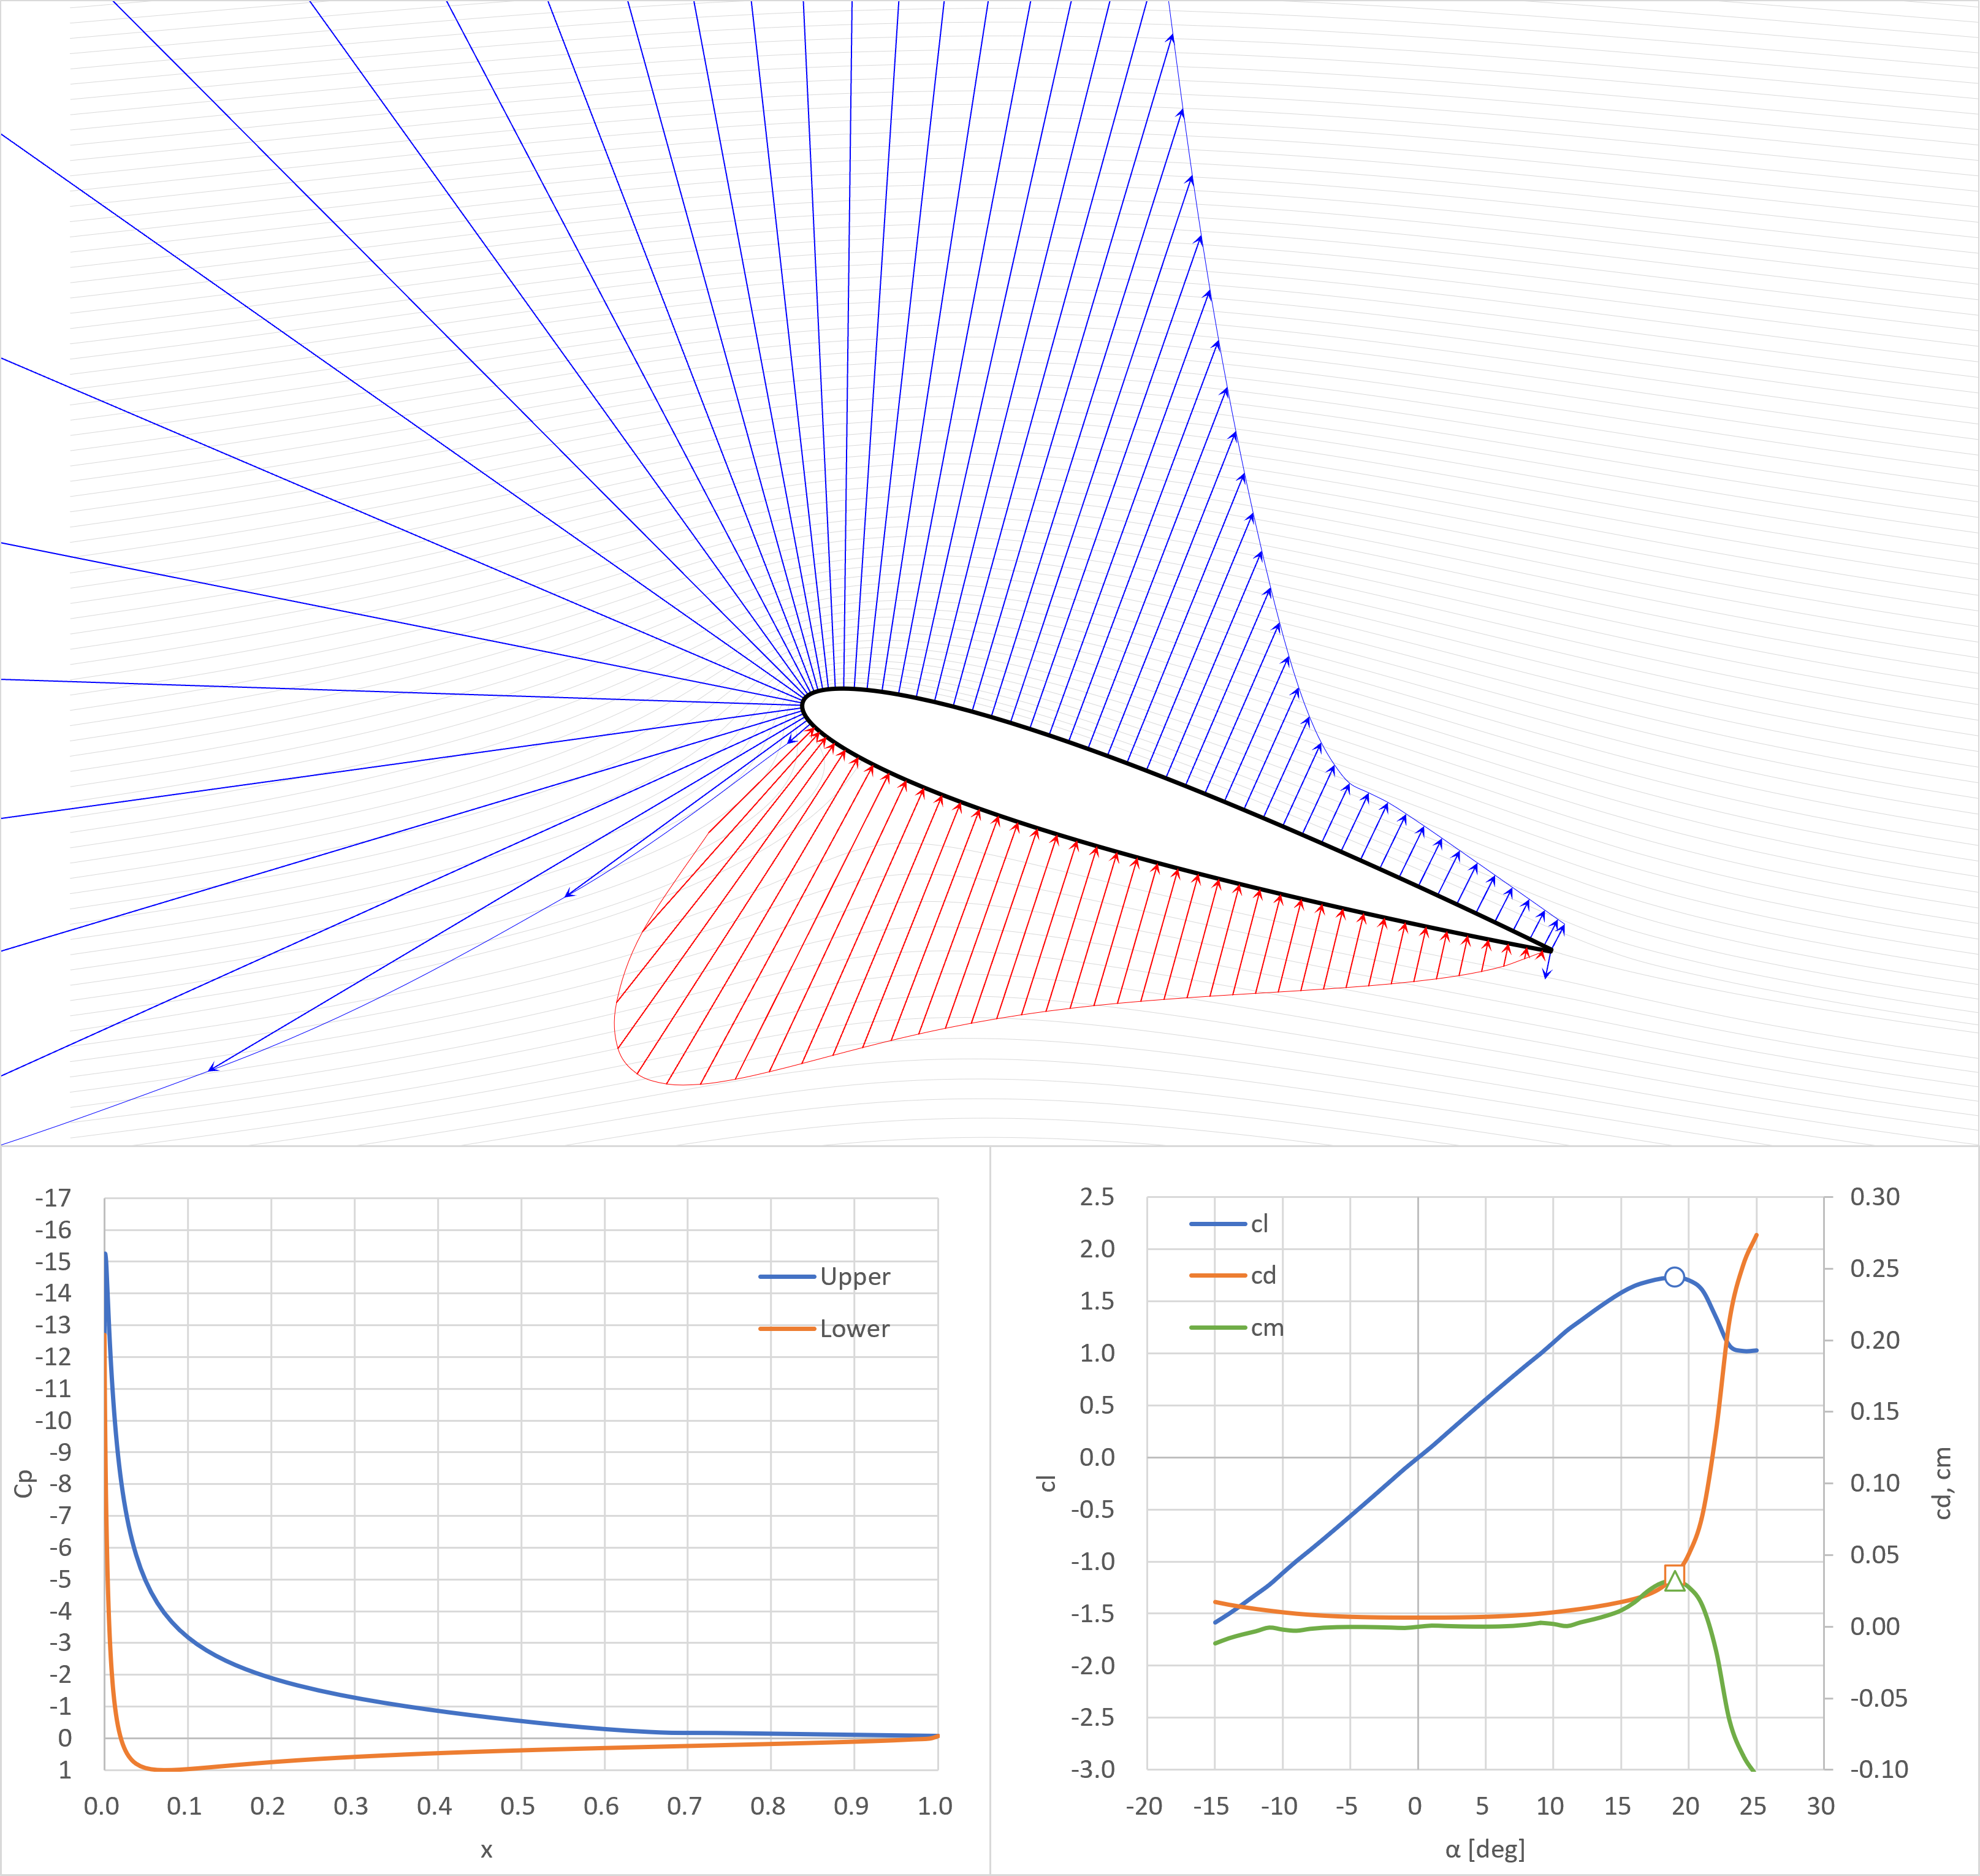
- 後縁のCp=0.078
失速角+4°
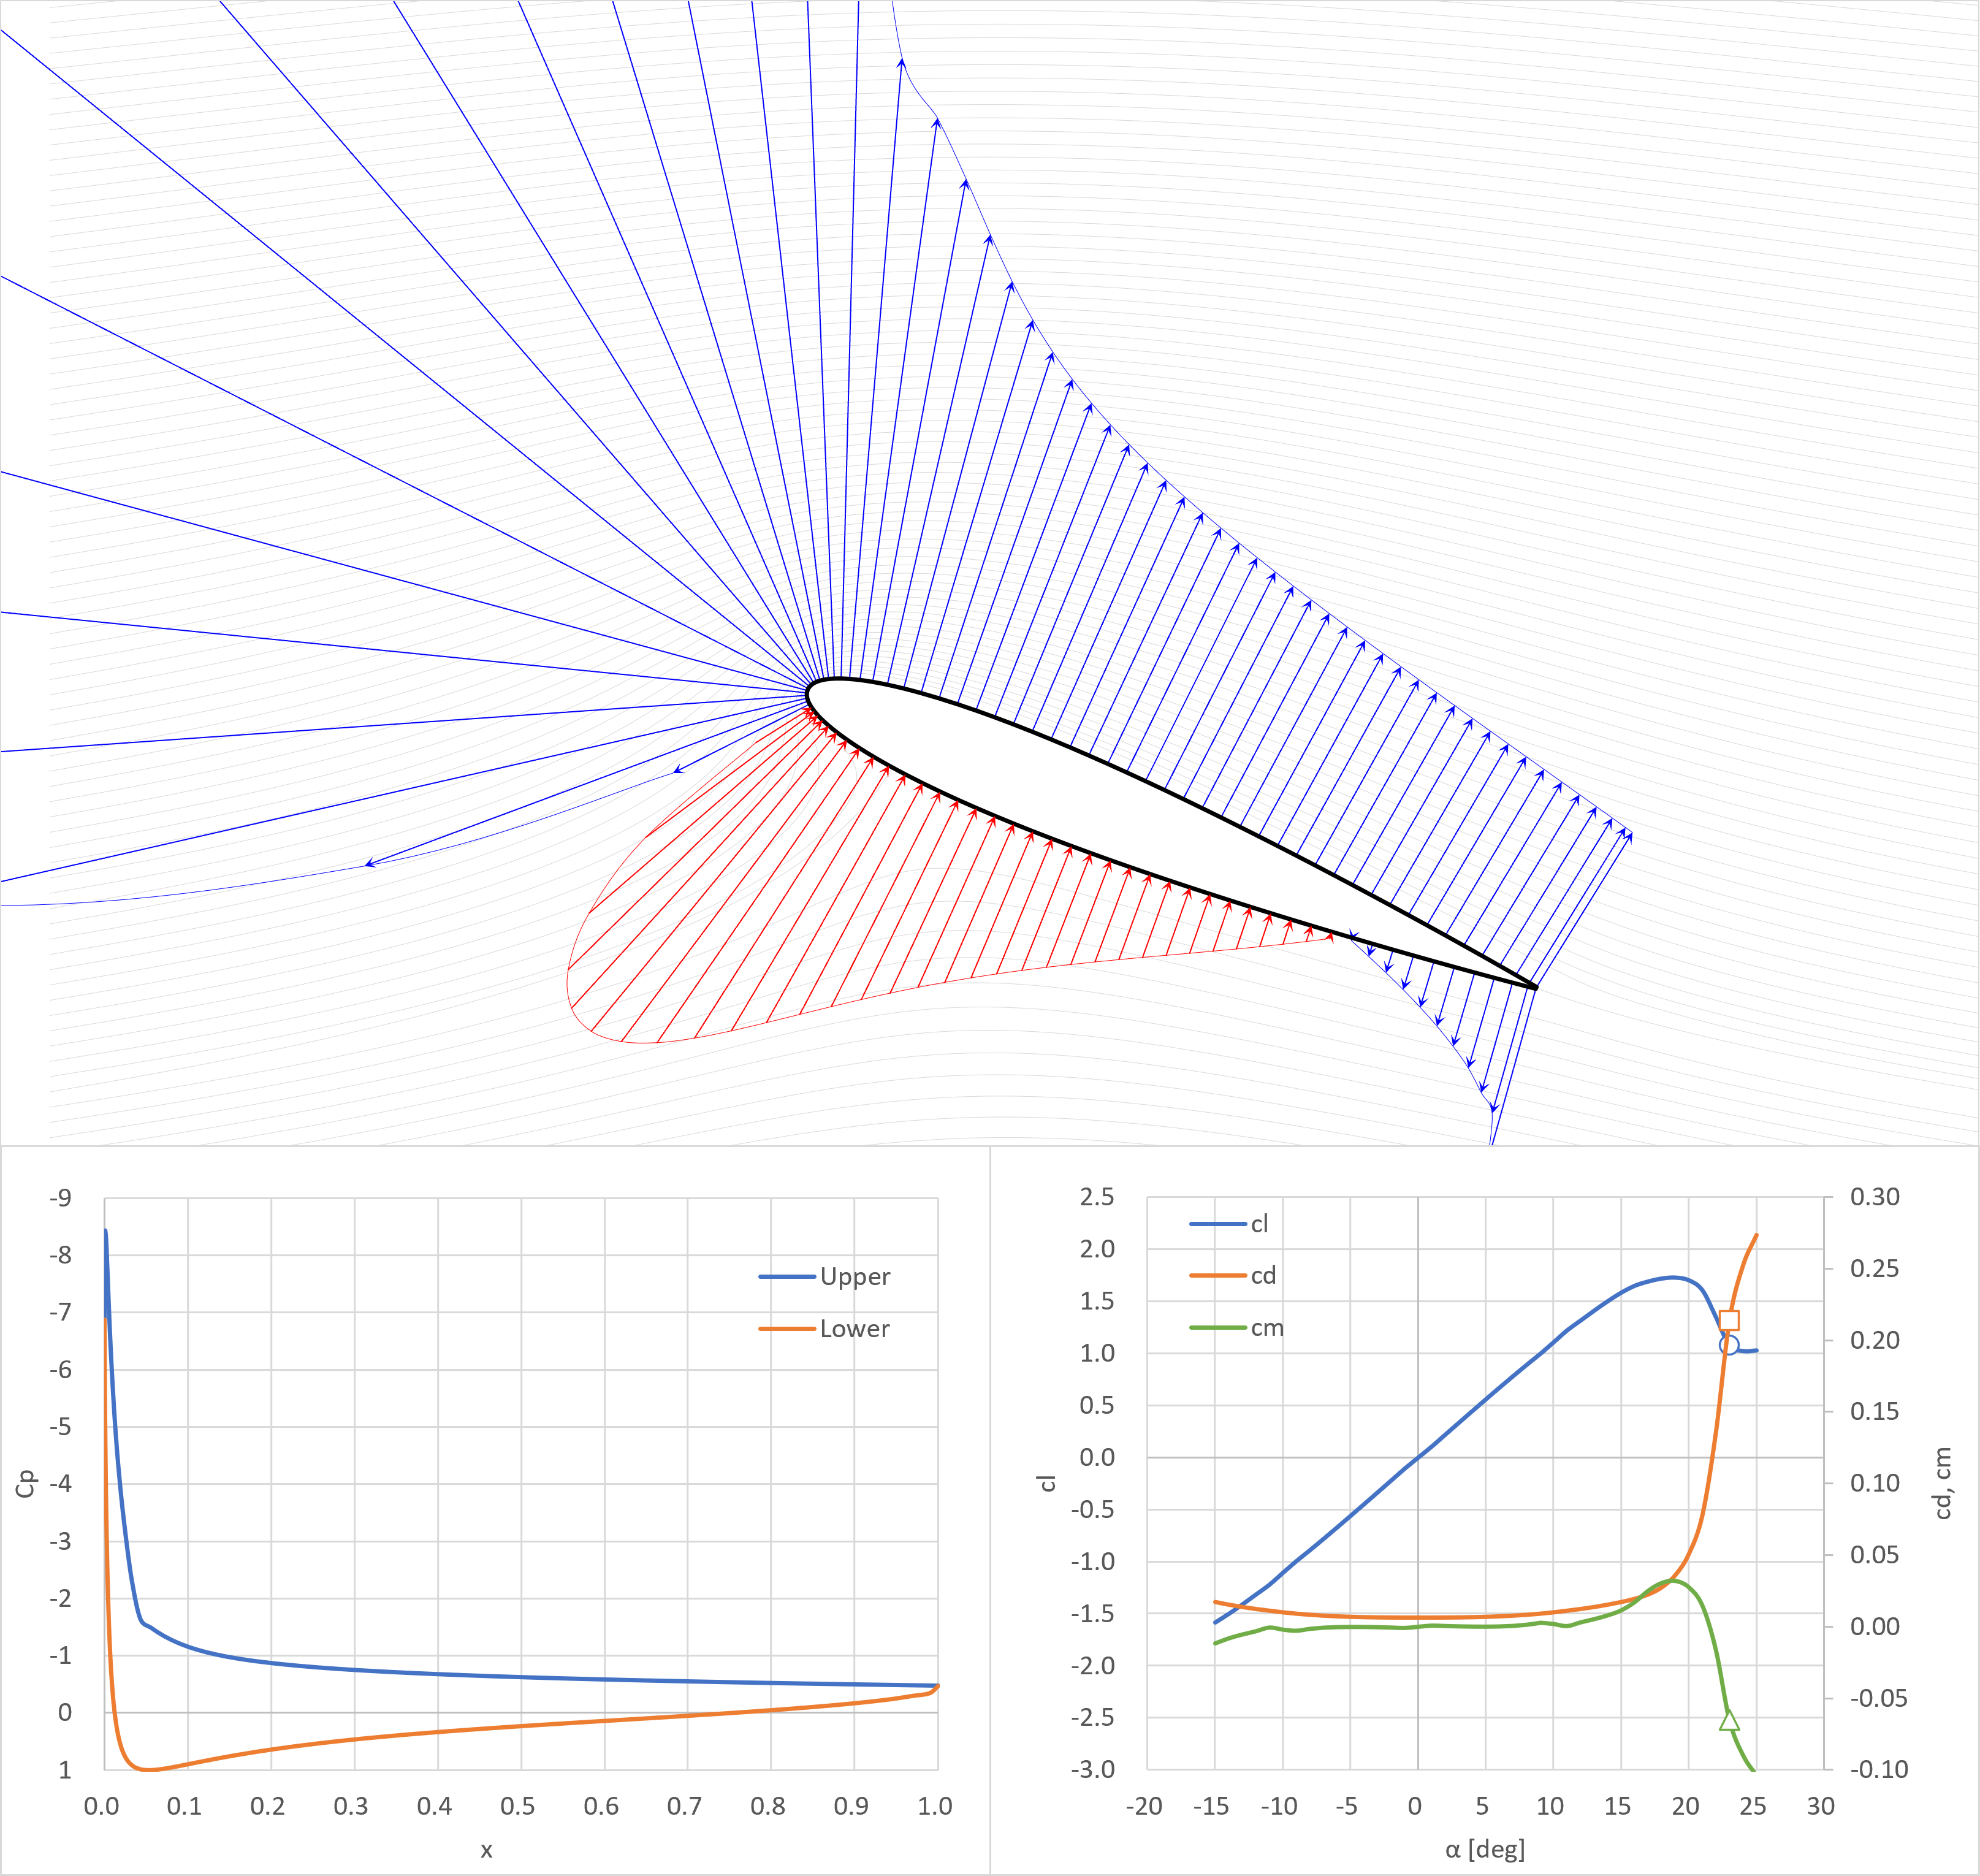
- 剥離領域が前縁付近まで到達
- 後縁のCp=-0.4717
- 剥離領域では圧力一定
- 翼表面の圧力は境界層の外側と同じ
キャンバー翼(NACA4412)
XFOIL解析条件
- Re=1E7
- Mach=0
- xtr=(0,0) ※前縁で強制遷移
ゼロ揚力角
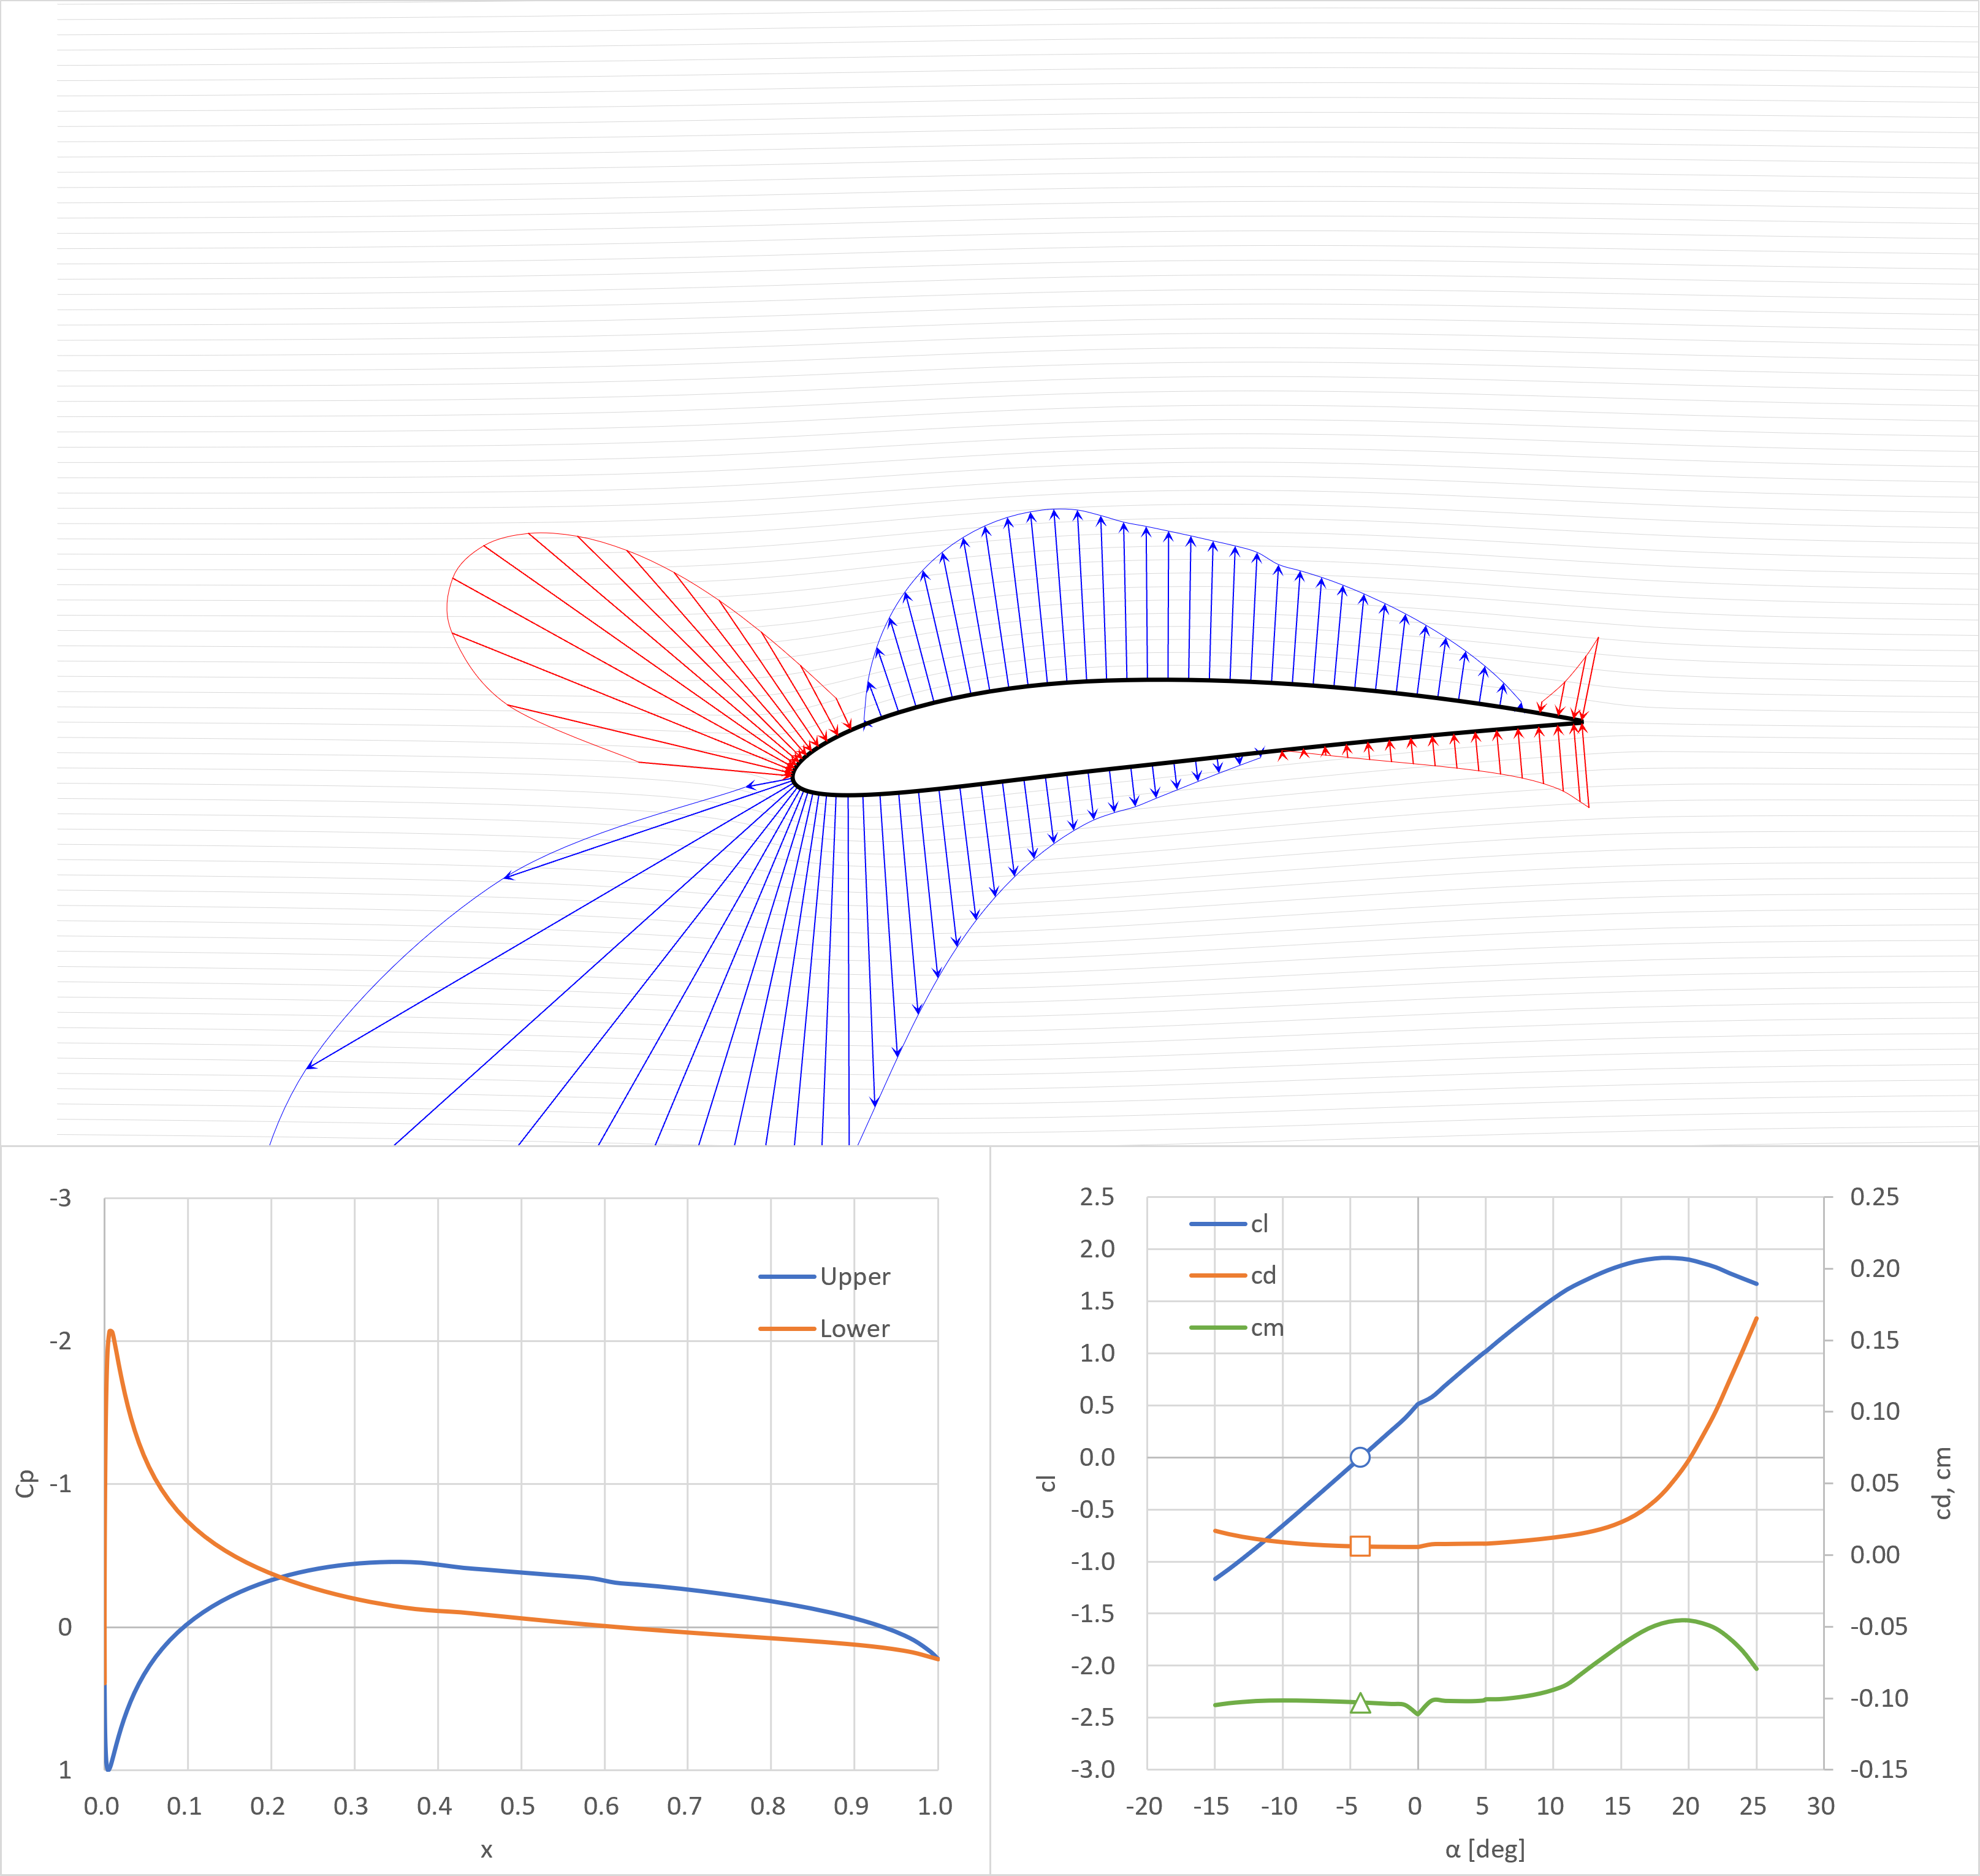
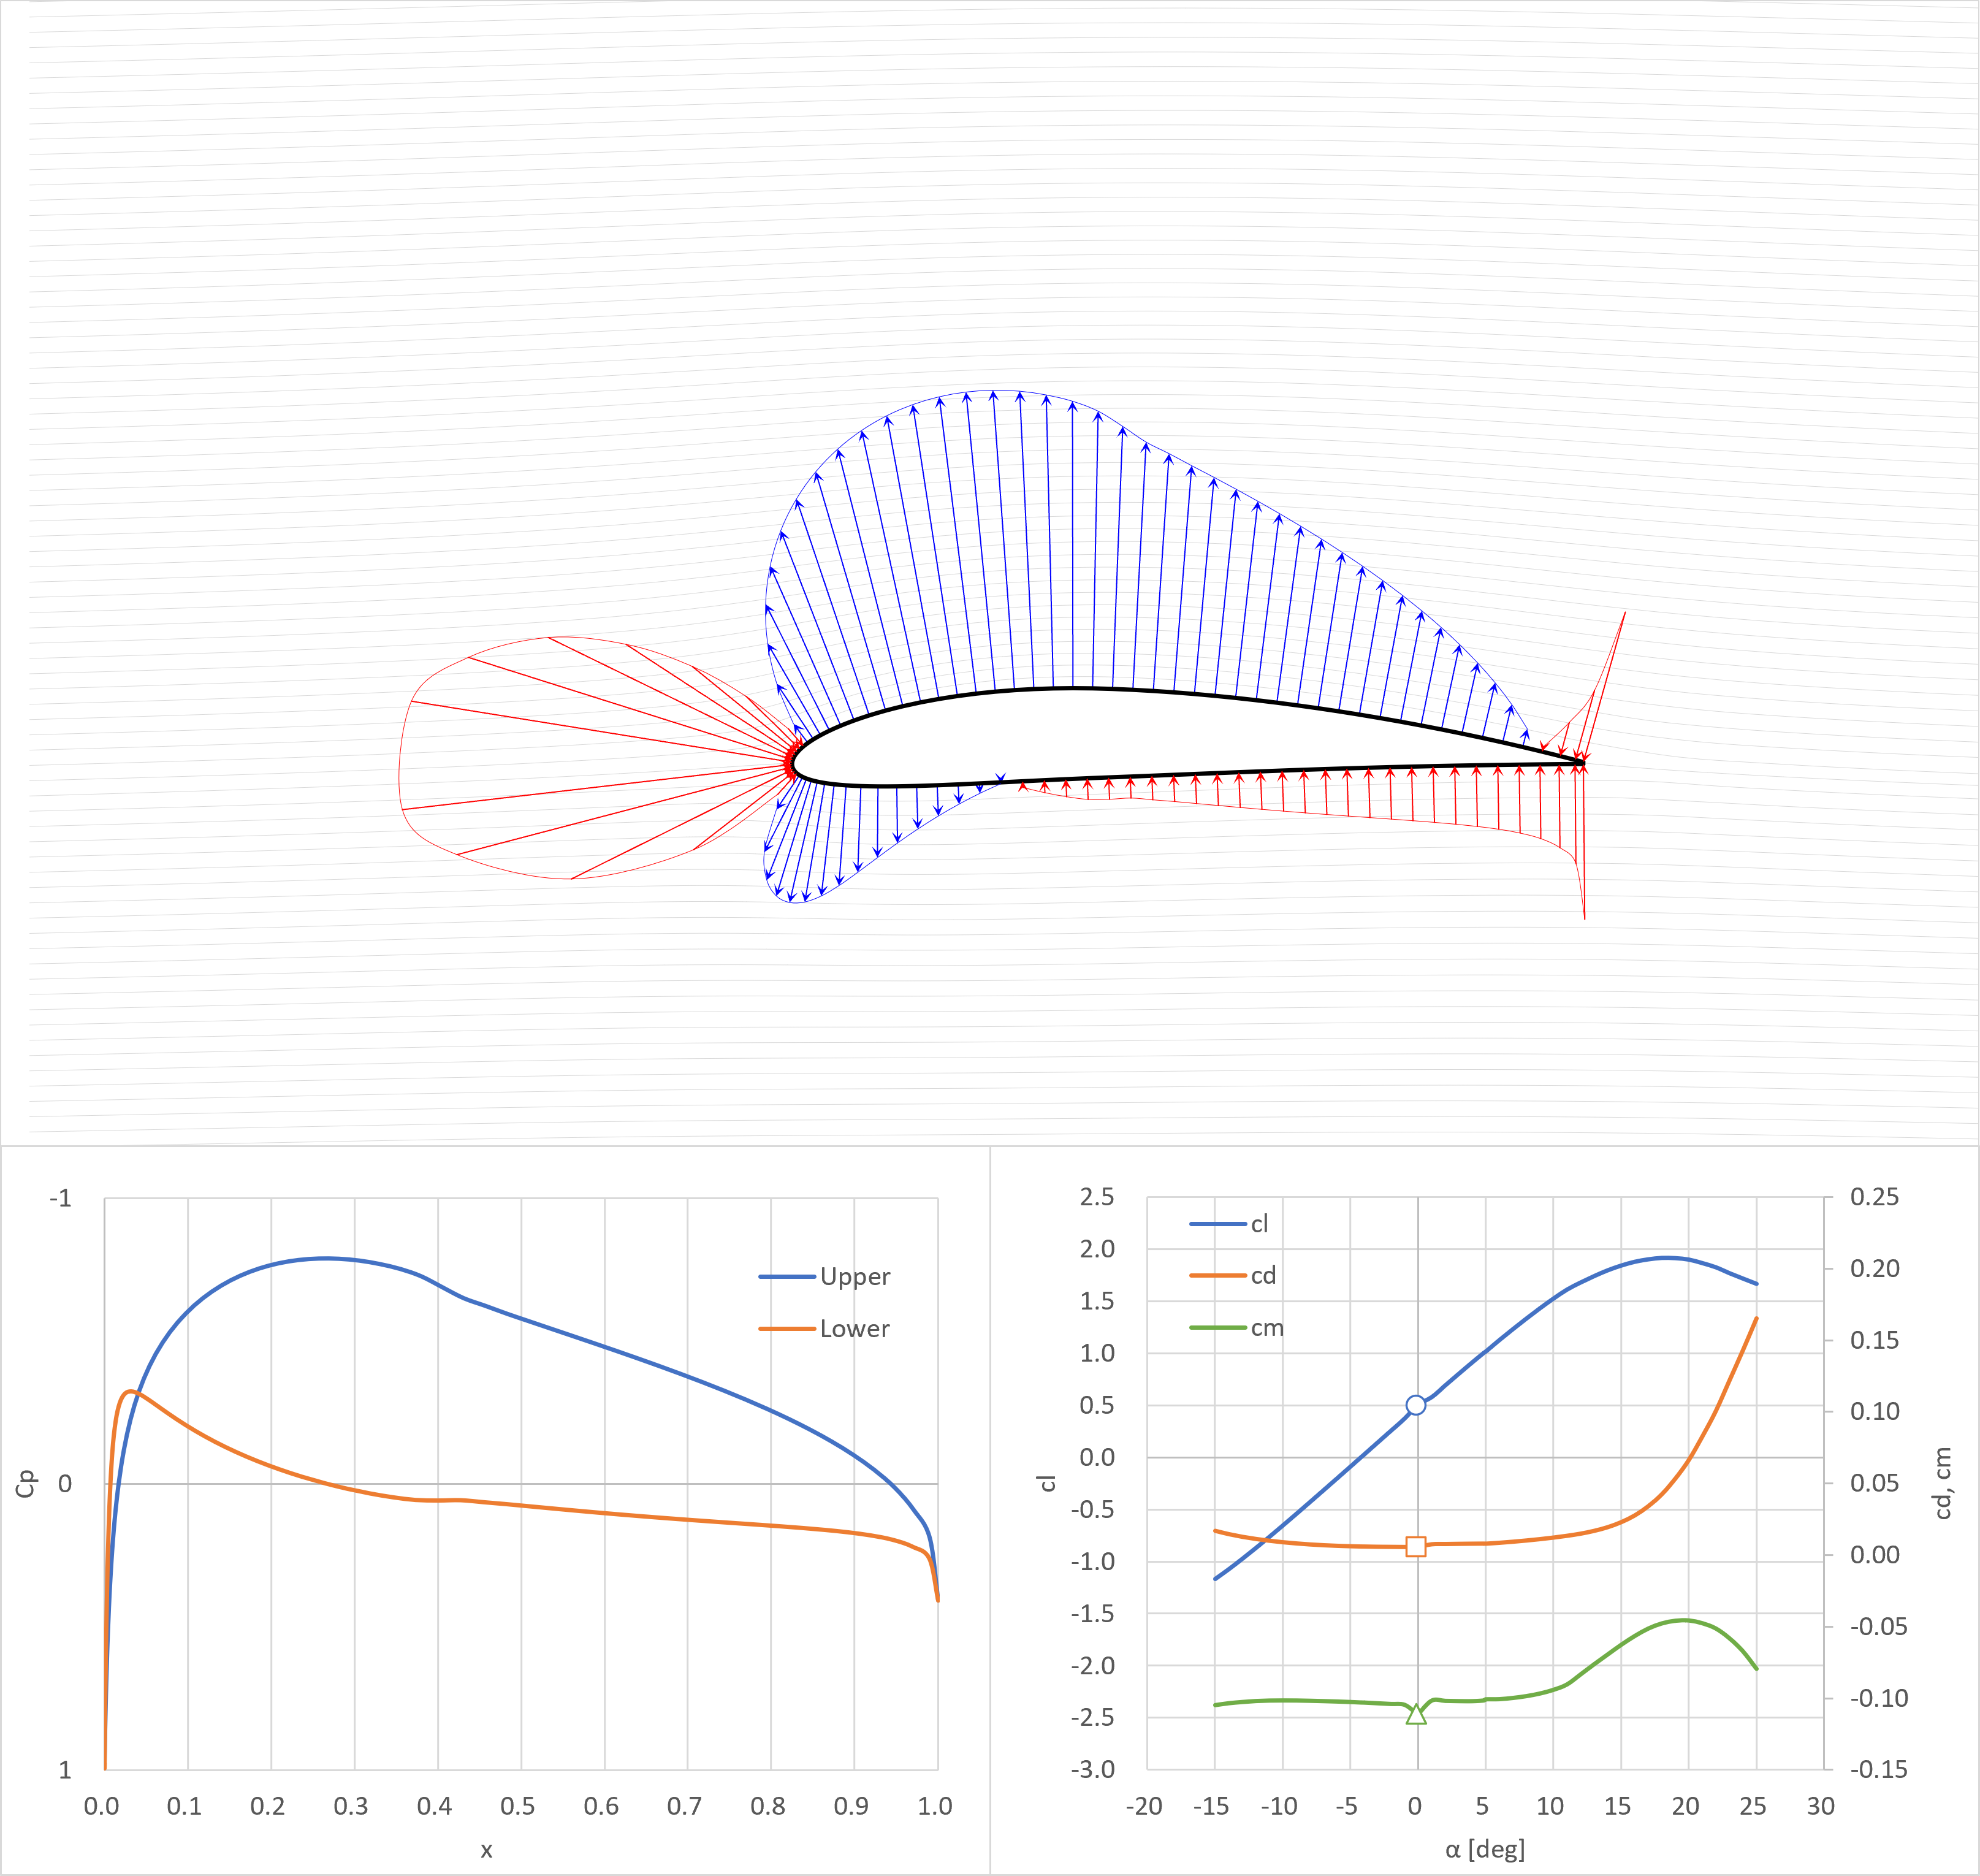
cl=0.5
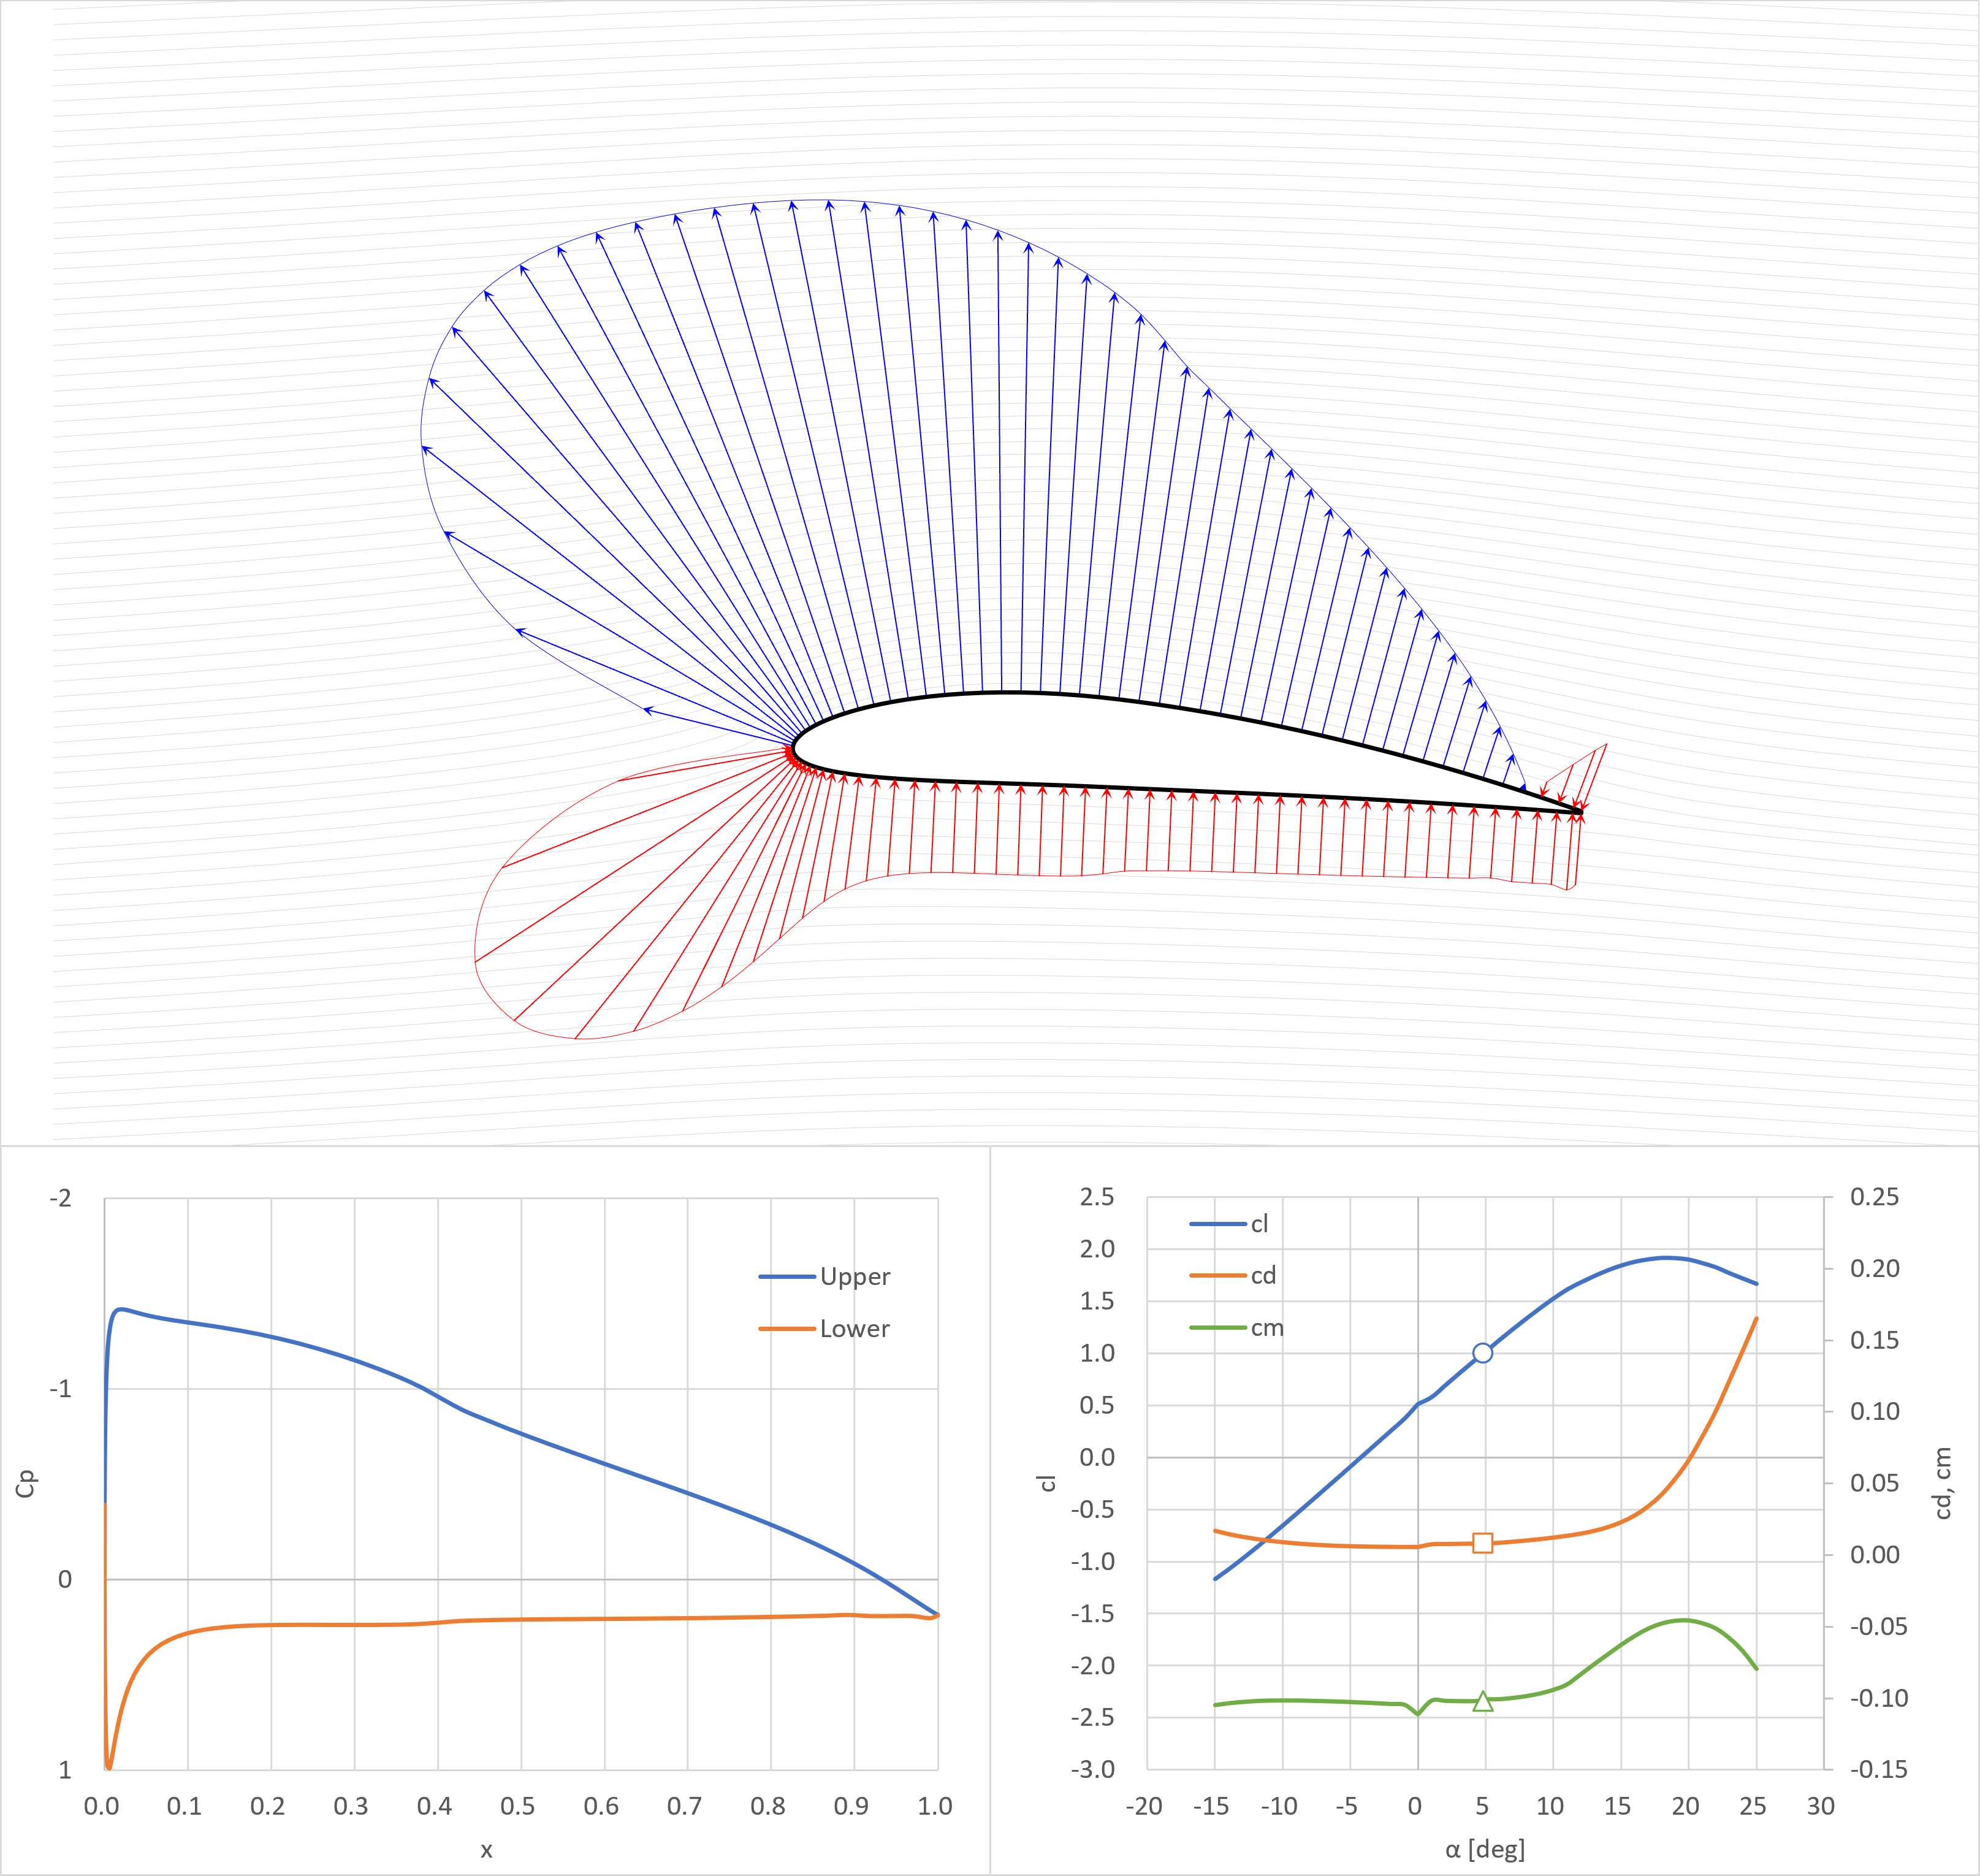
cl=1.0
失速角
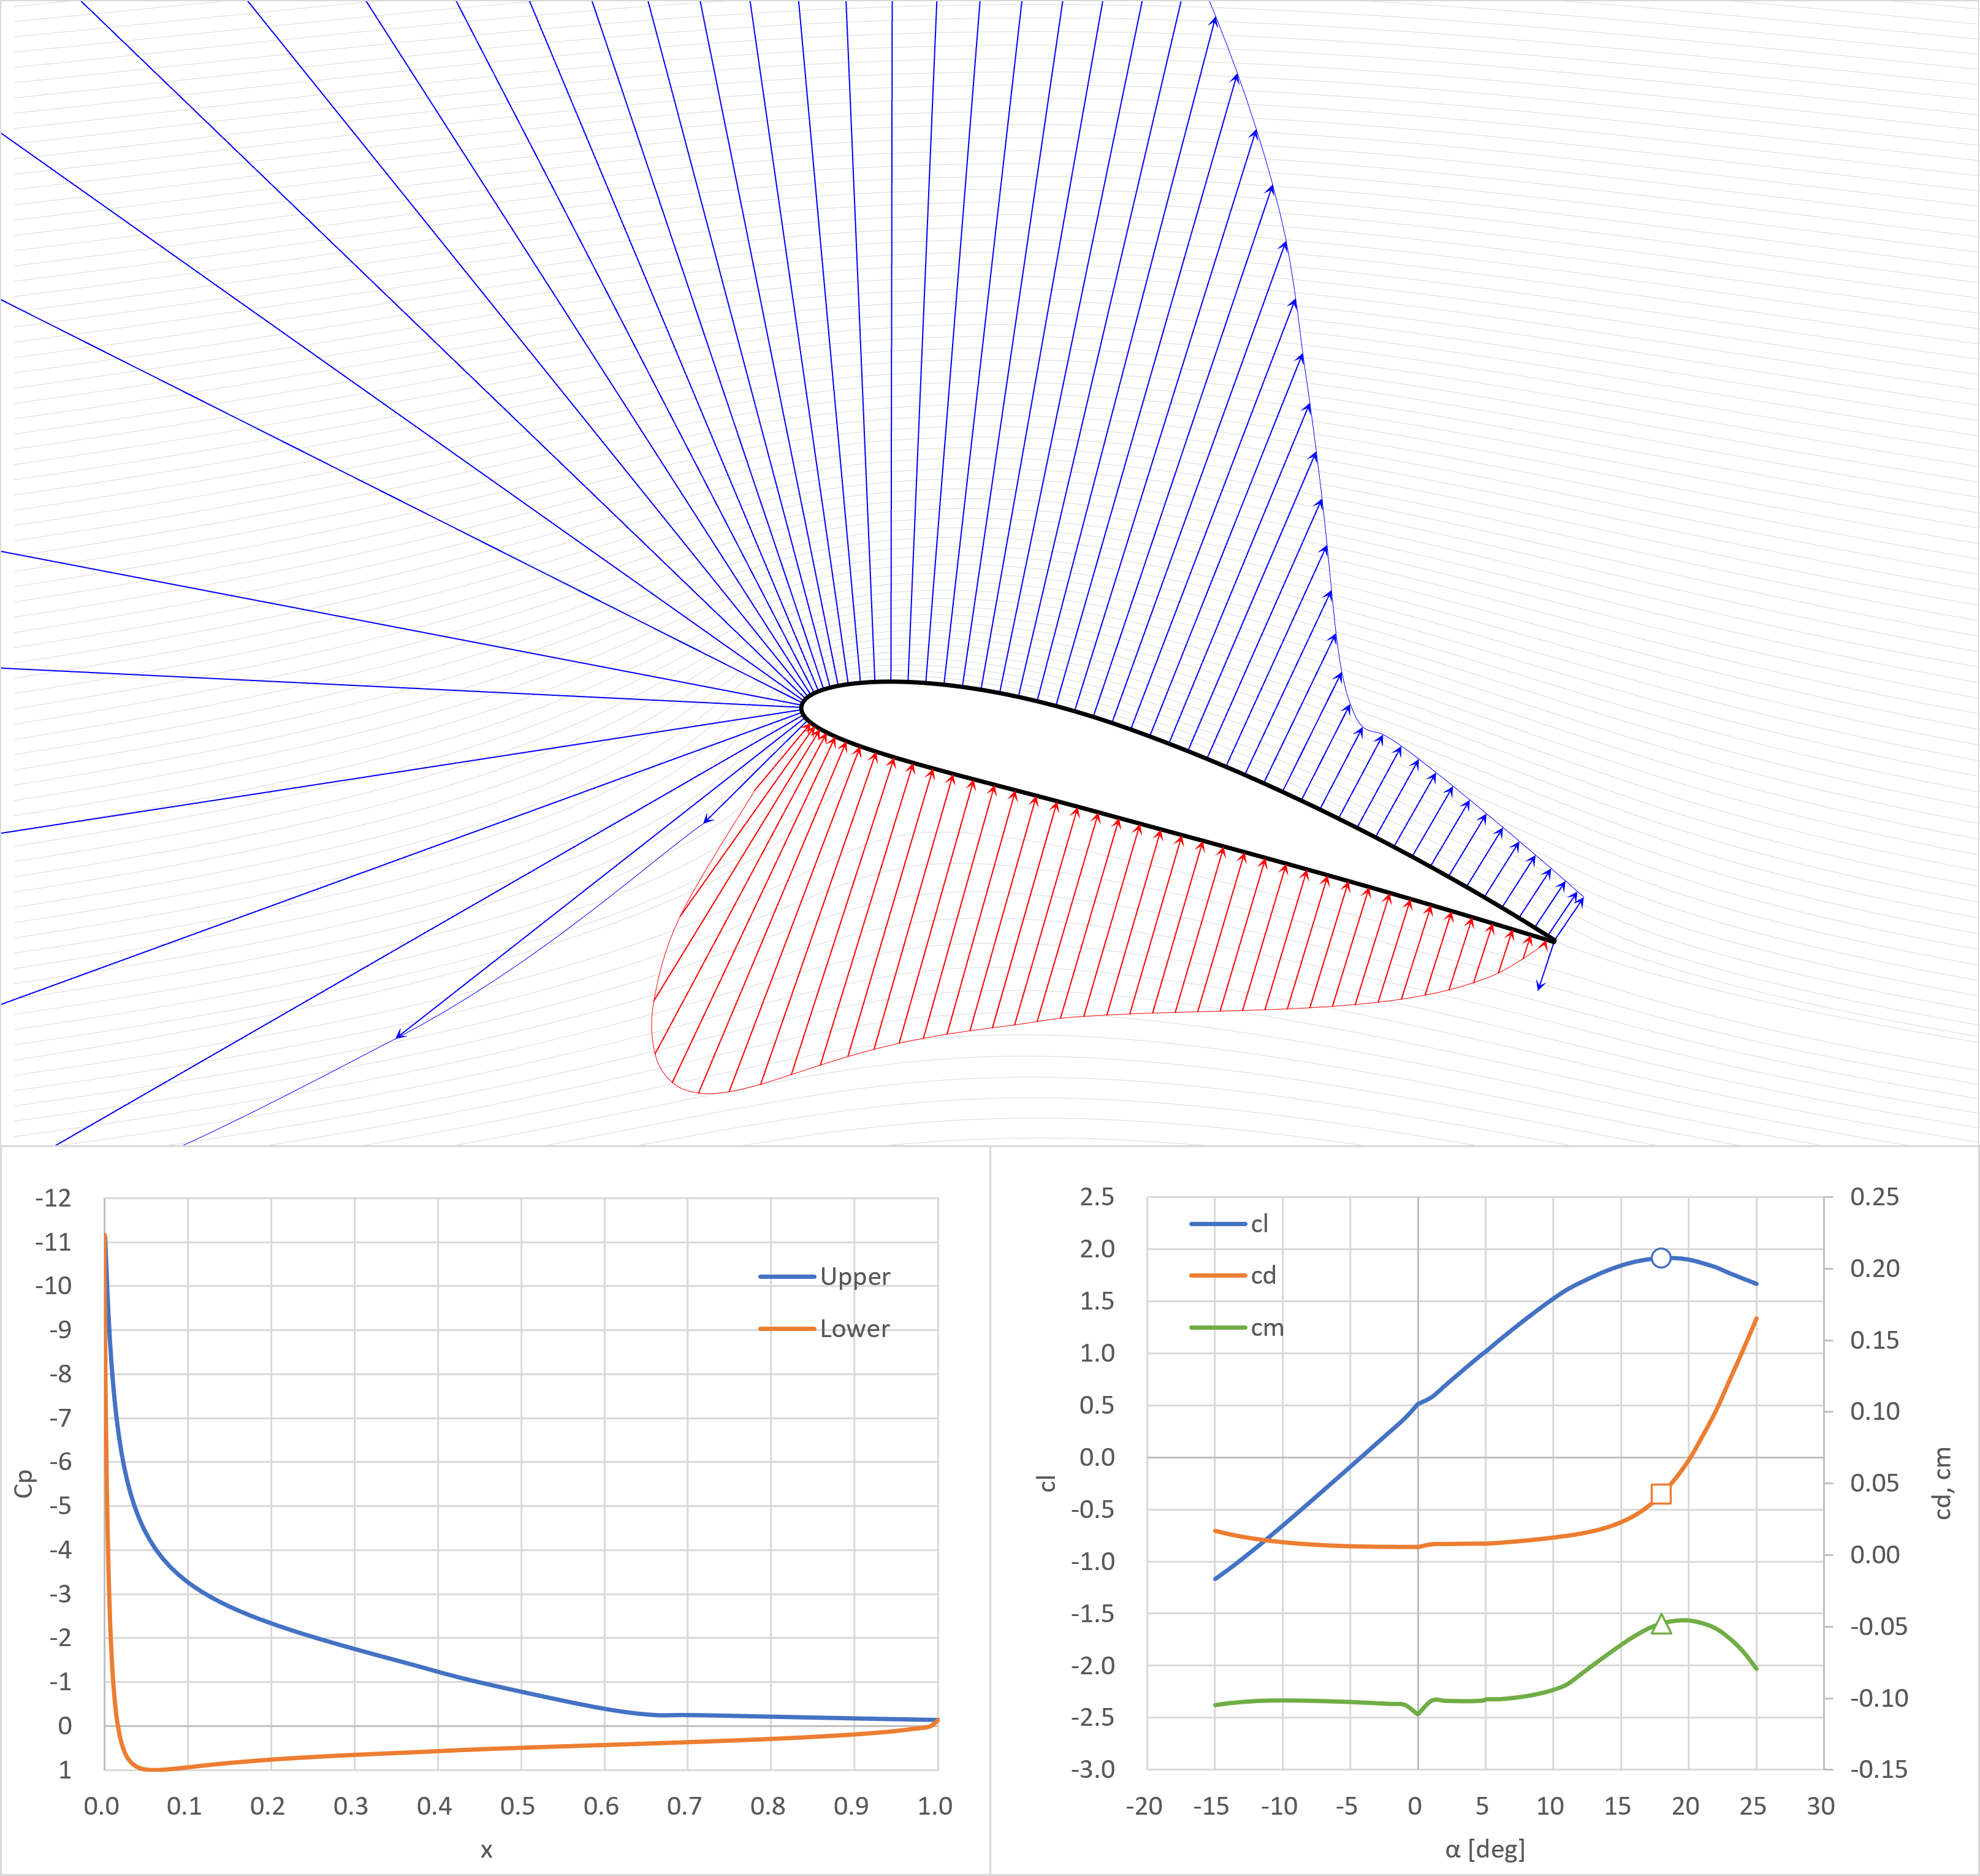
失速角+
反転キャンバー翼(NACA25112)
XFOIL解析条件
- Re=1E7
- Mach=0
- xtr=(0,0) ※前縁で強制遷移
ゼロ揚力角
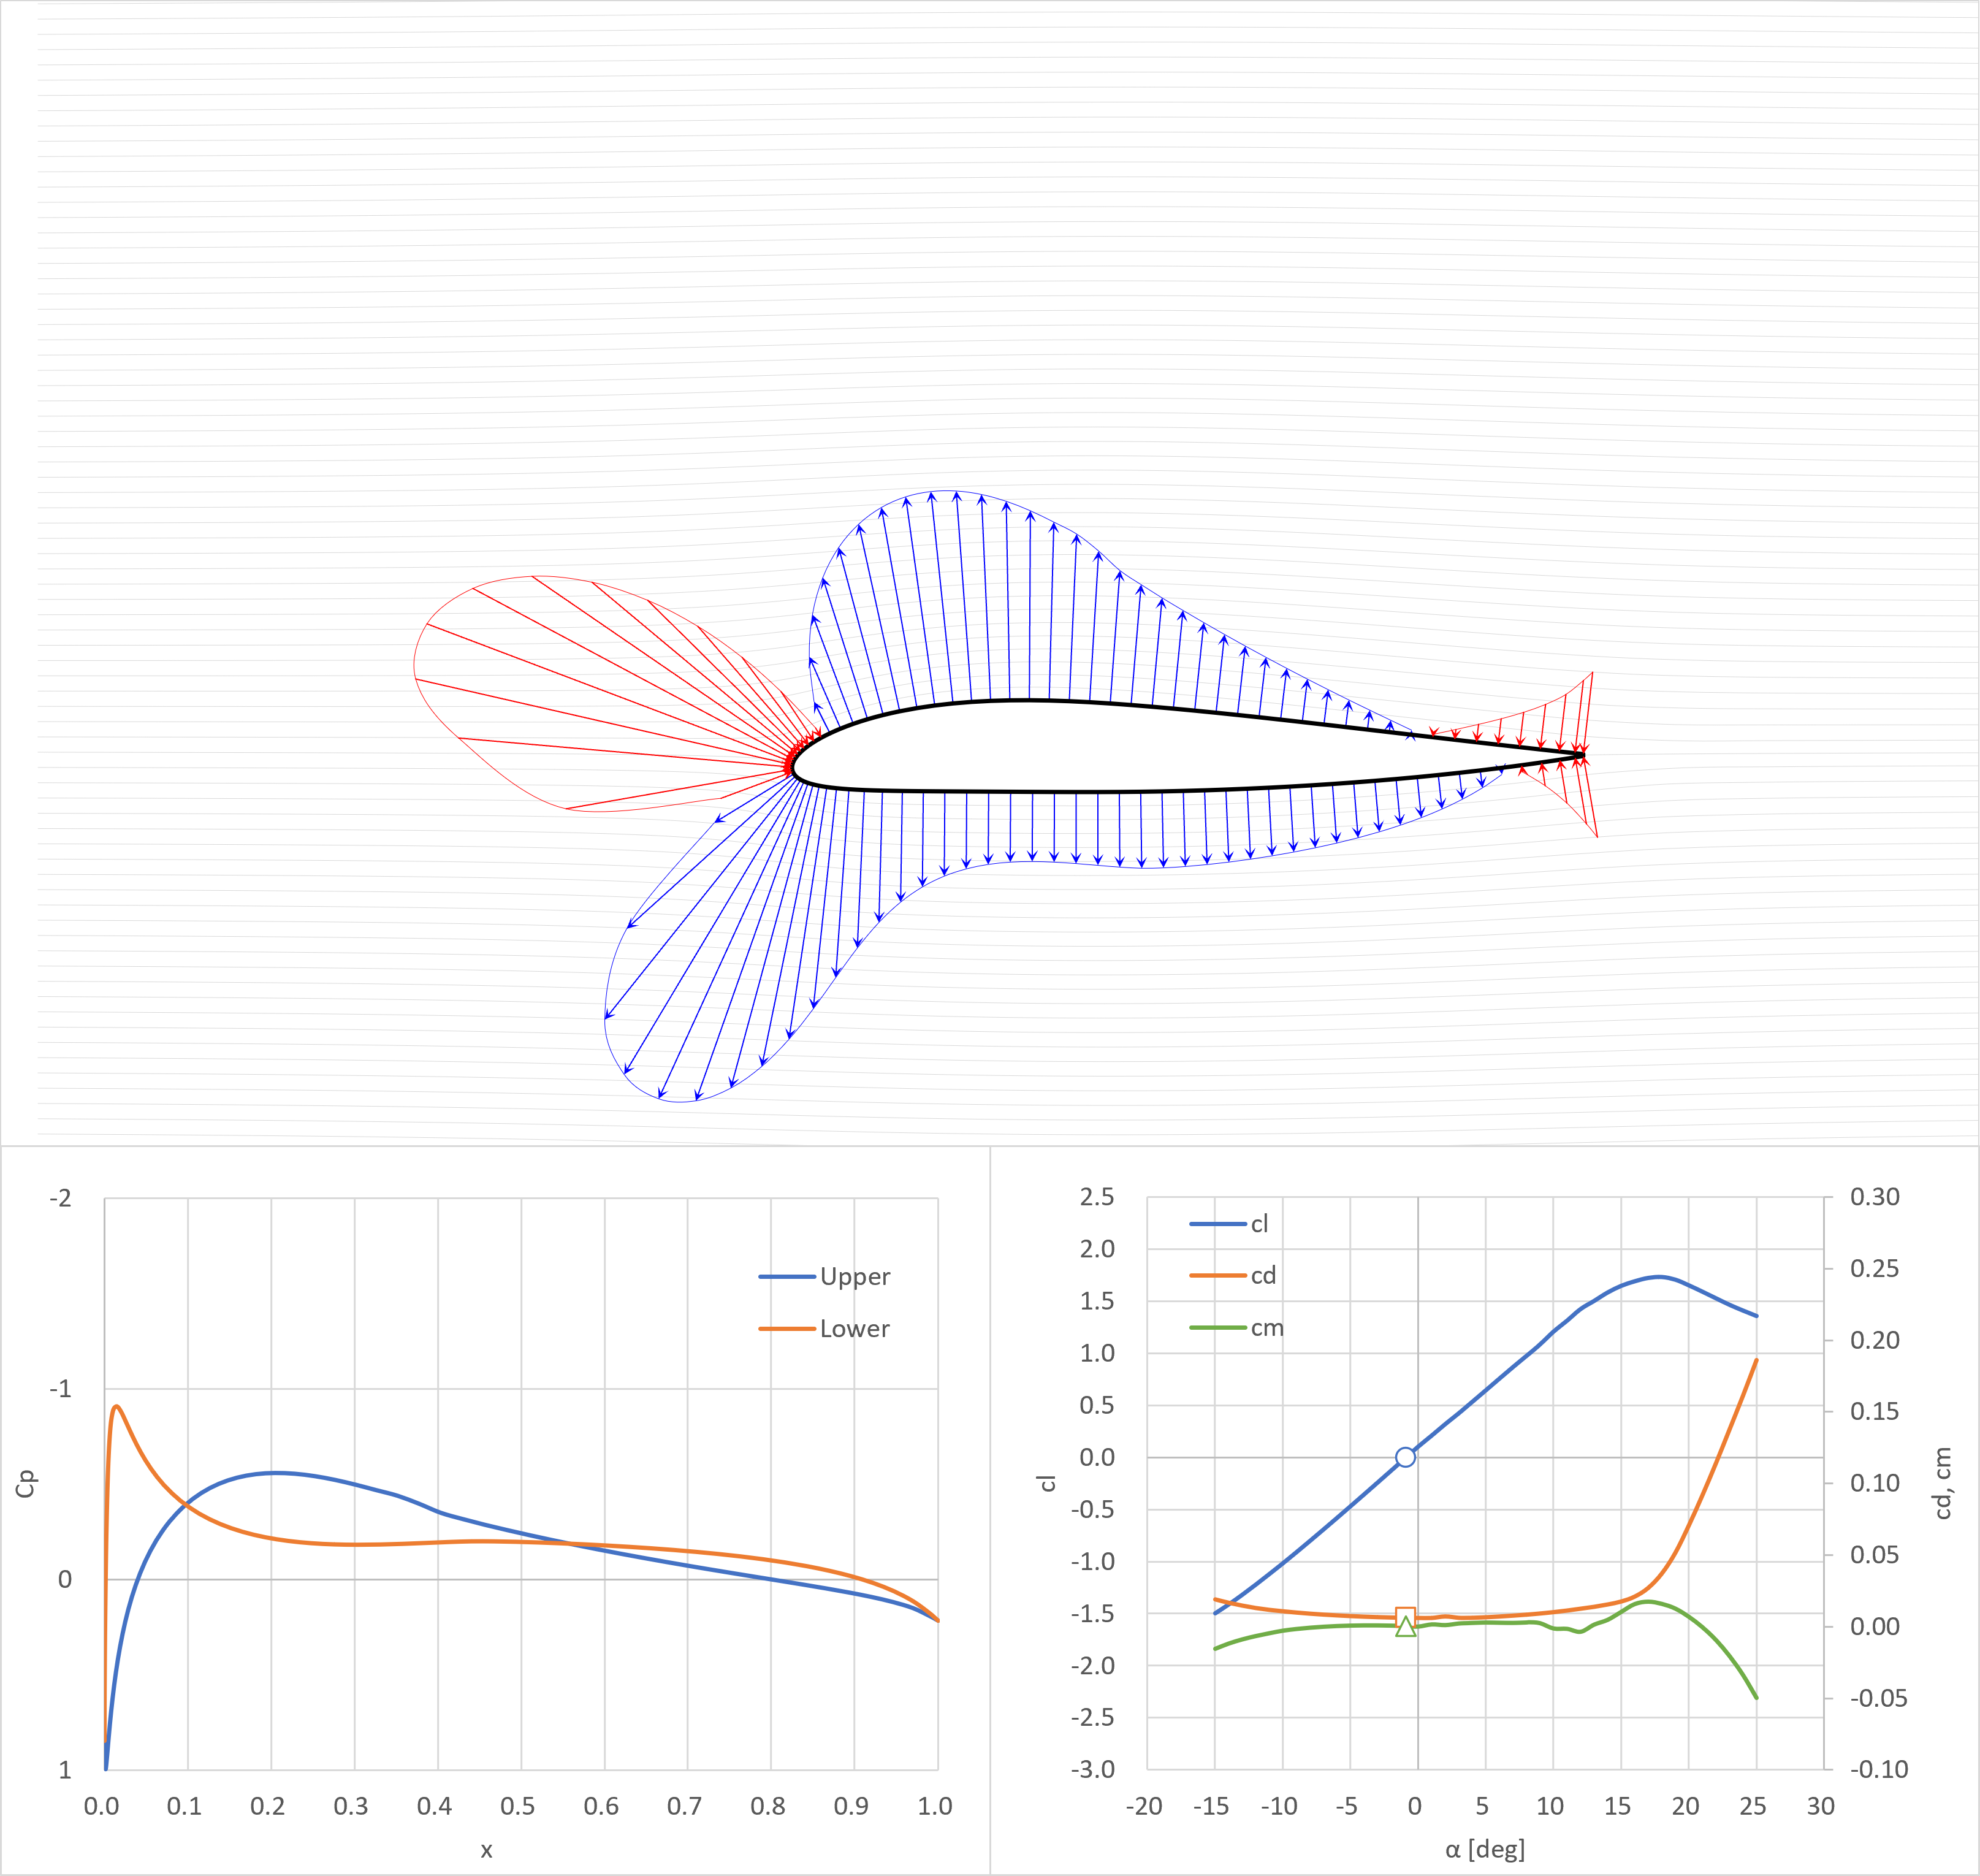
- 翼後縁付近で下面の圧力の方が上面よりも低くなっている(下向きの力を生じている)
cl=0.5
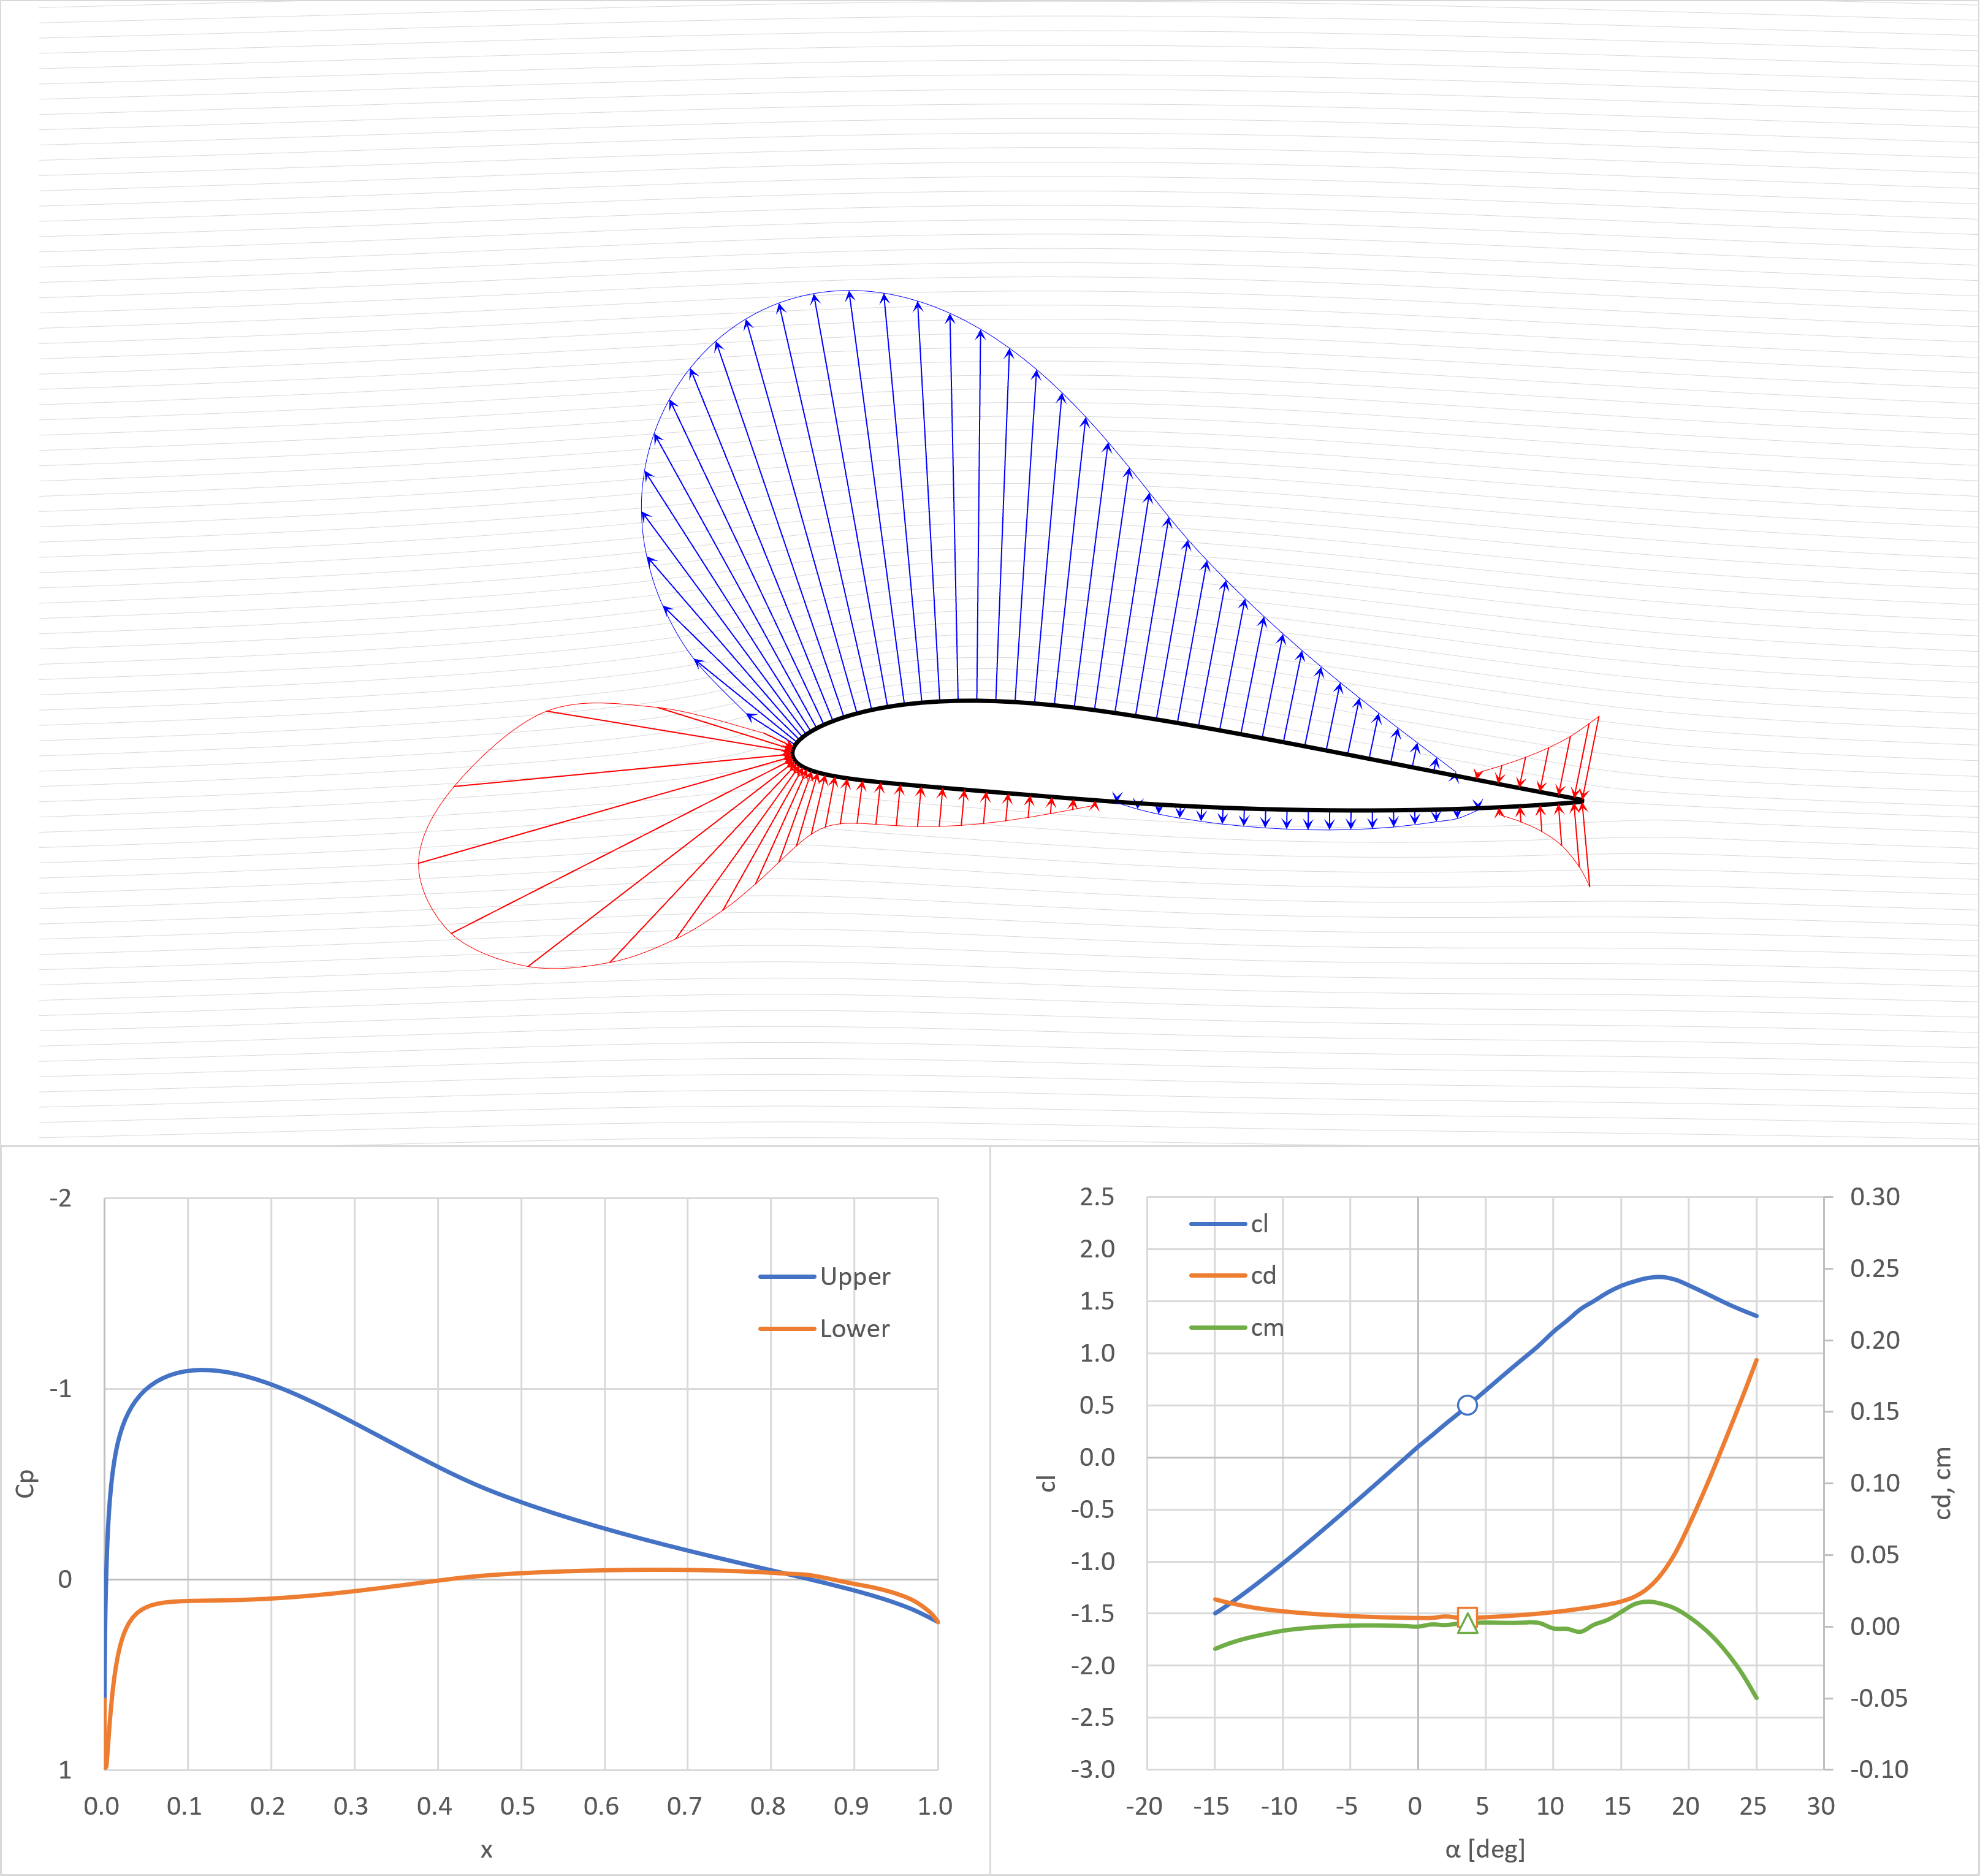
cl=1.0
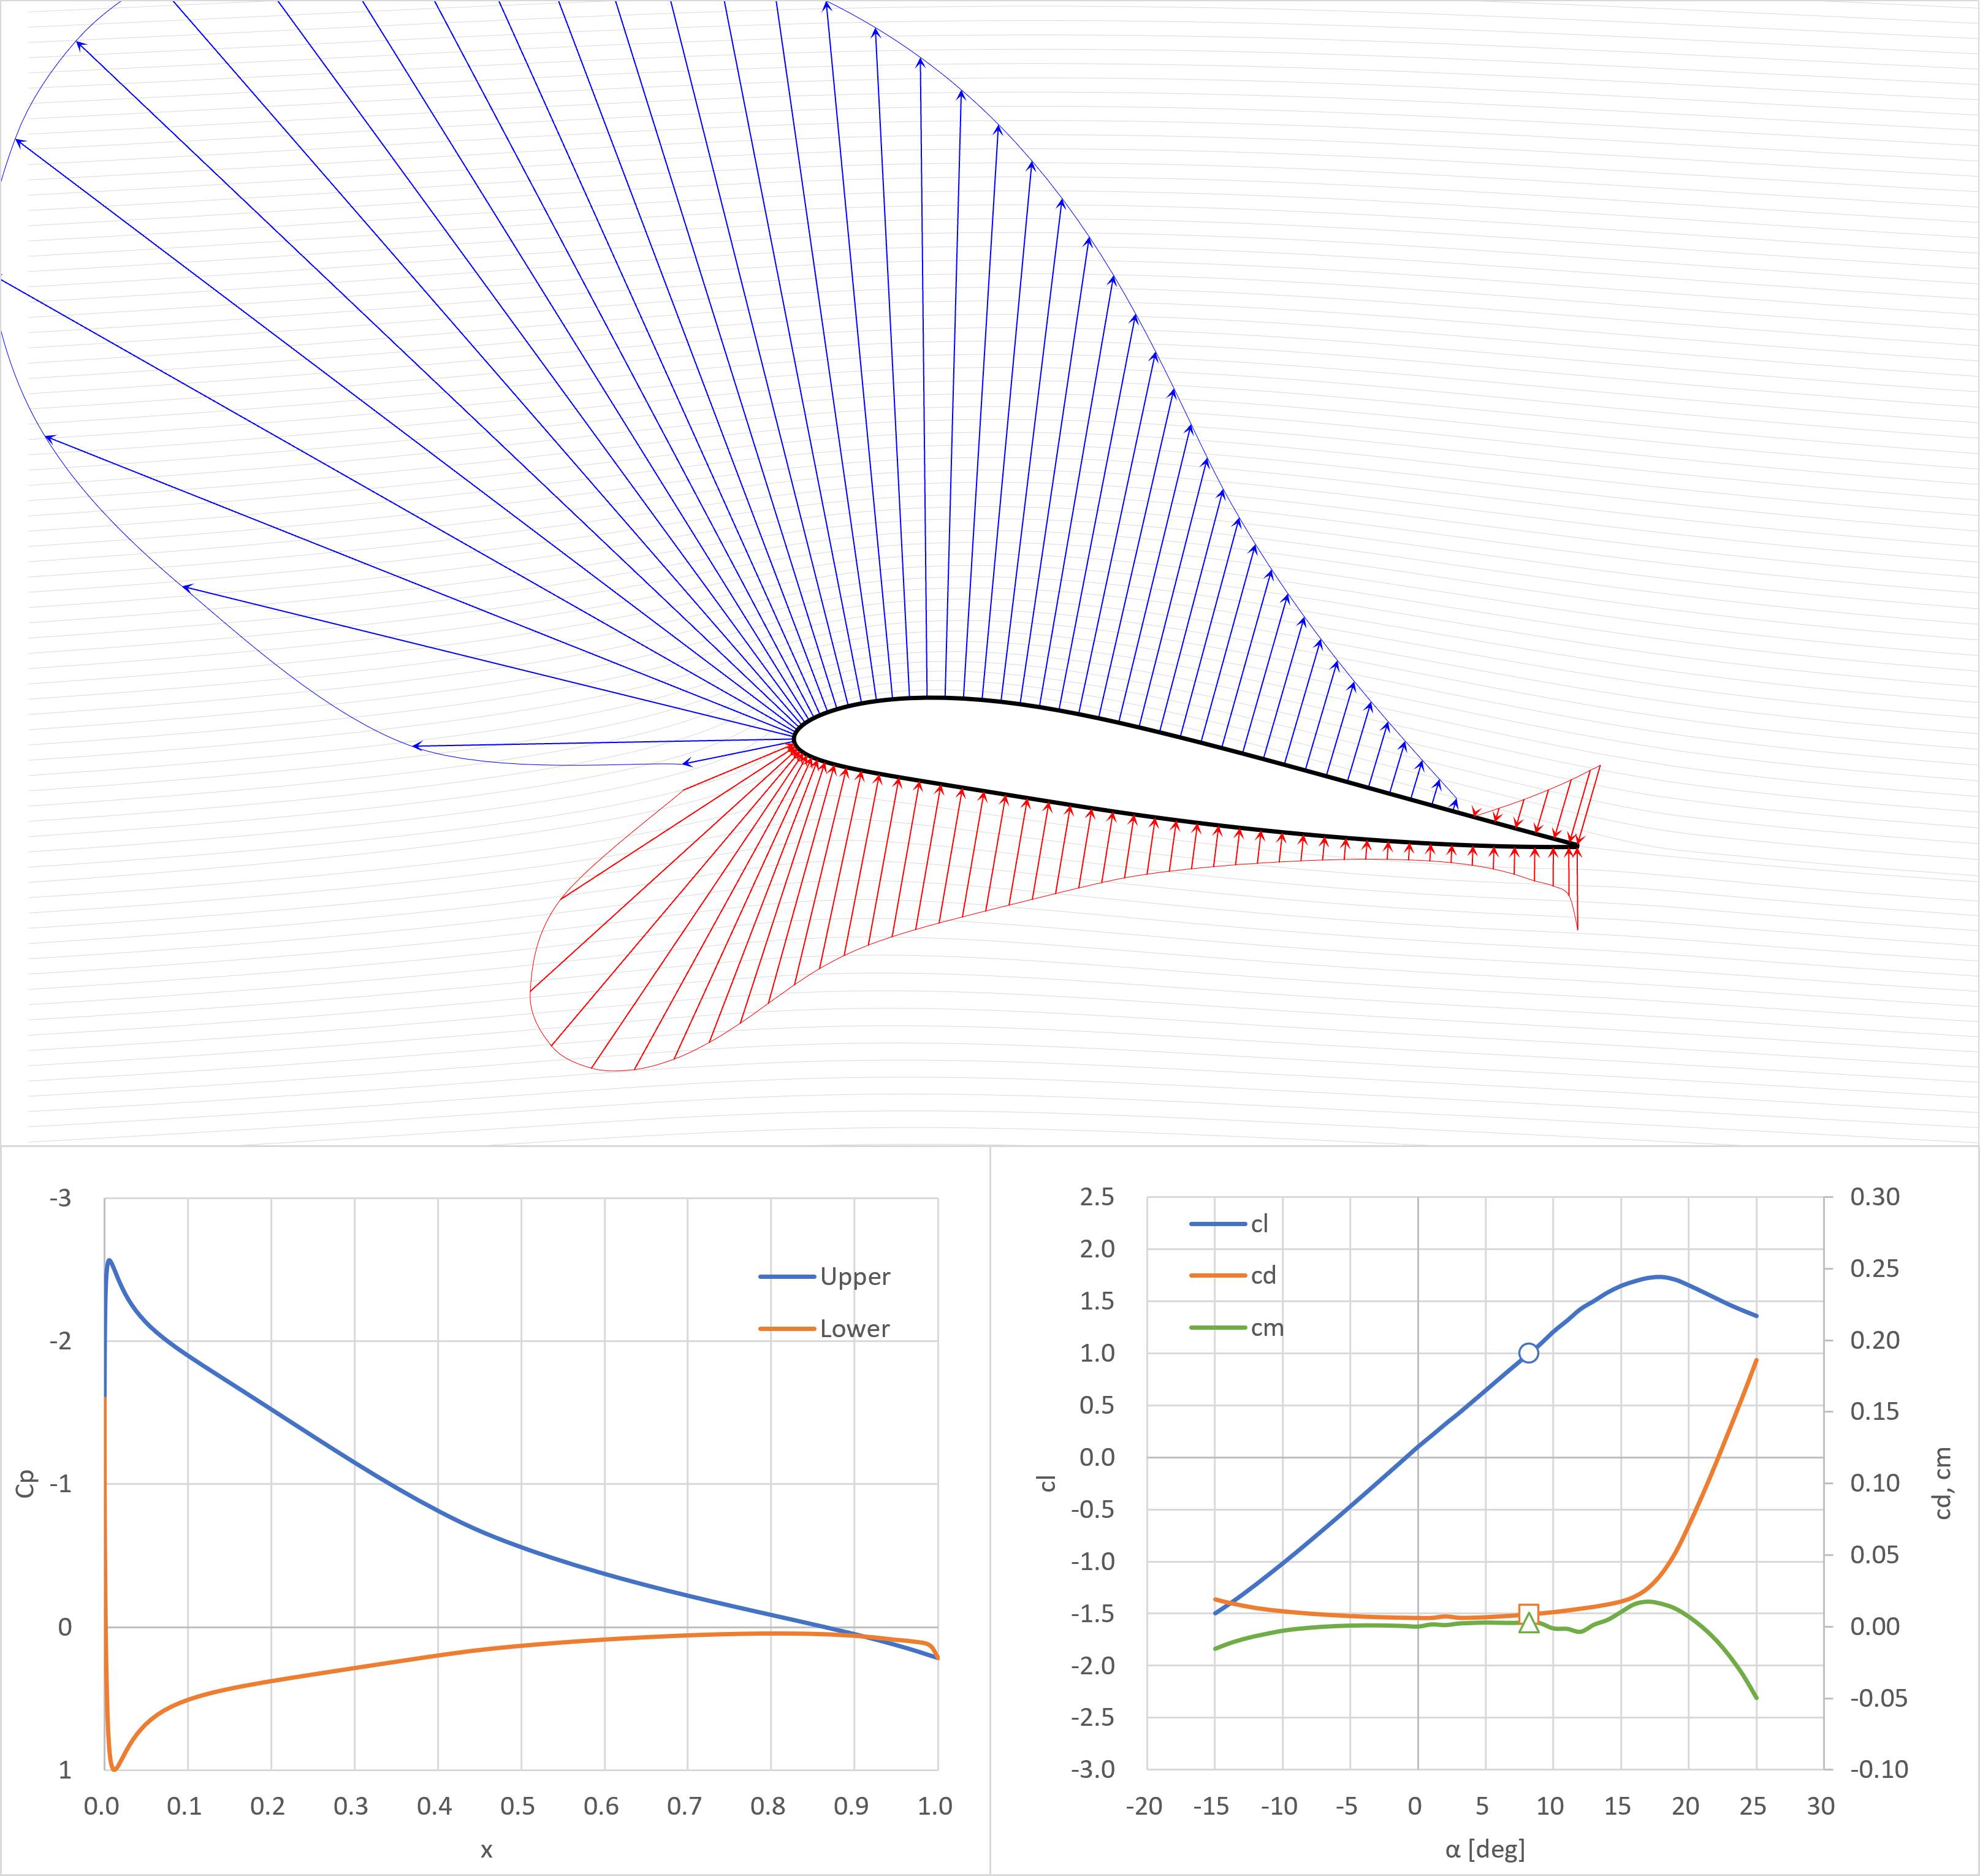
失速角
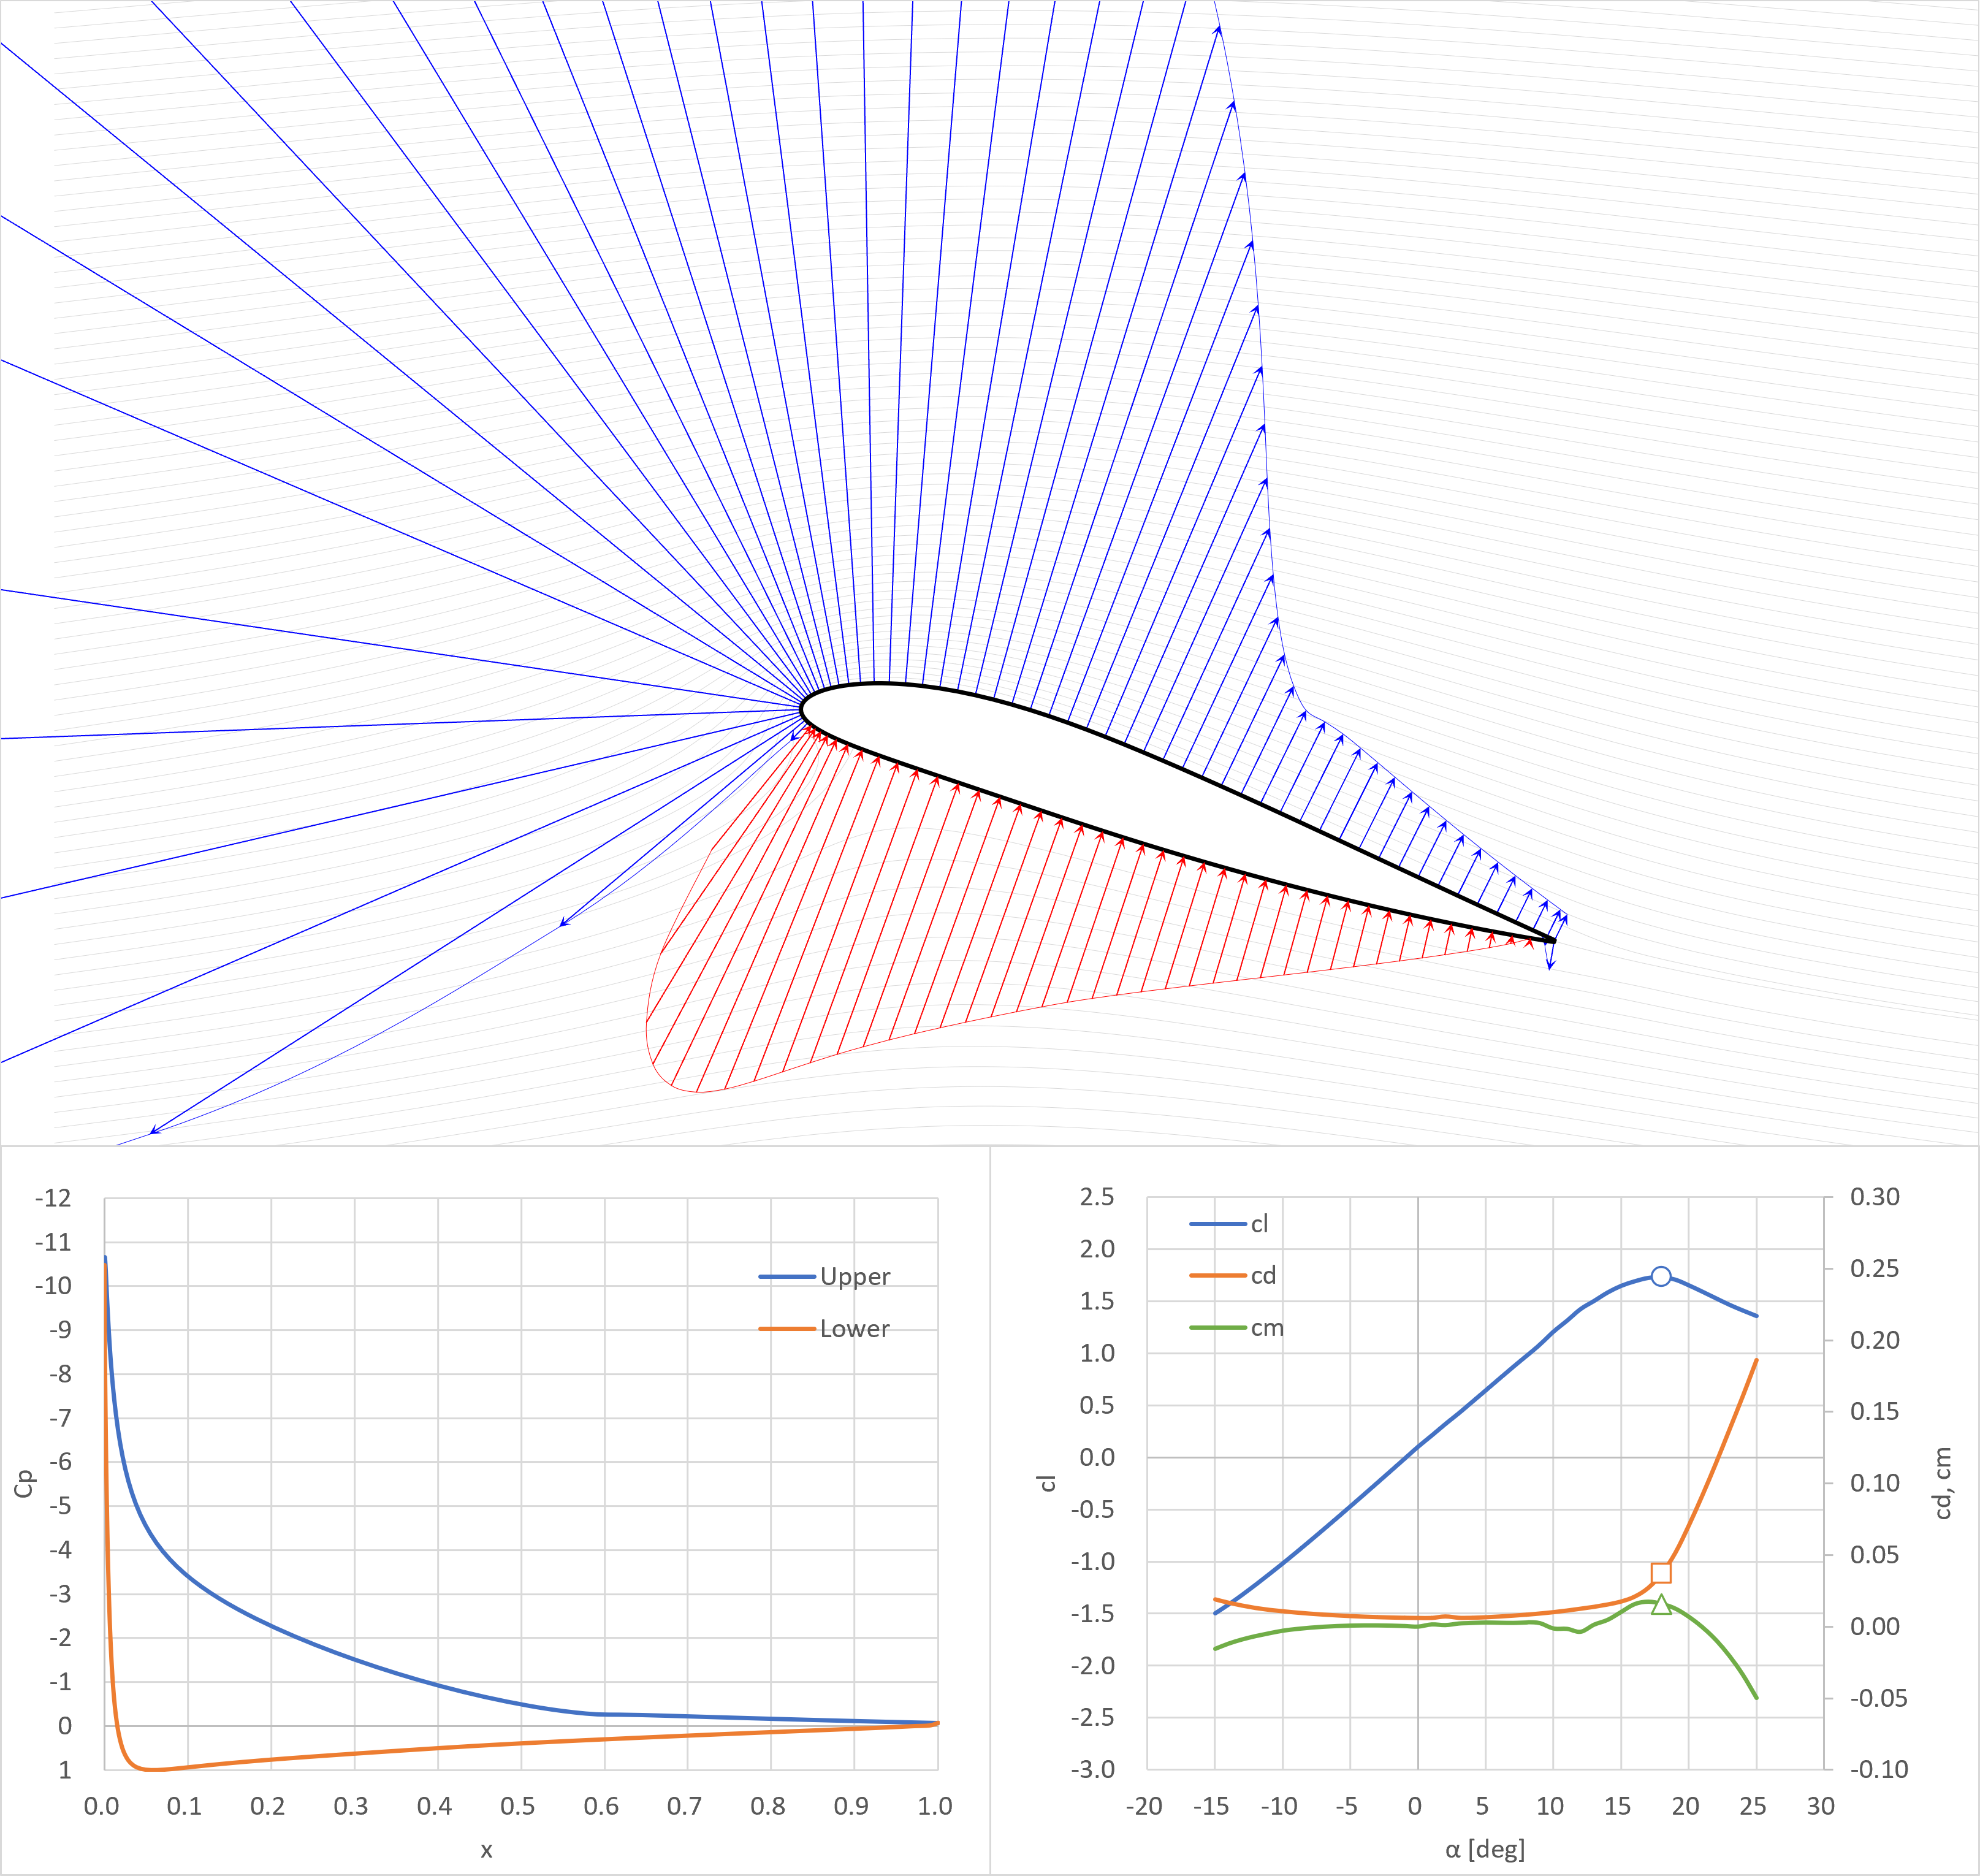
失速角+4°
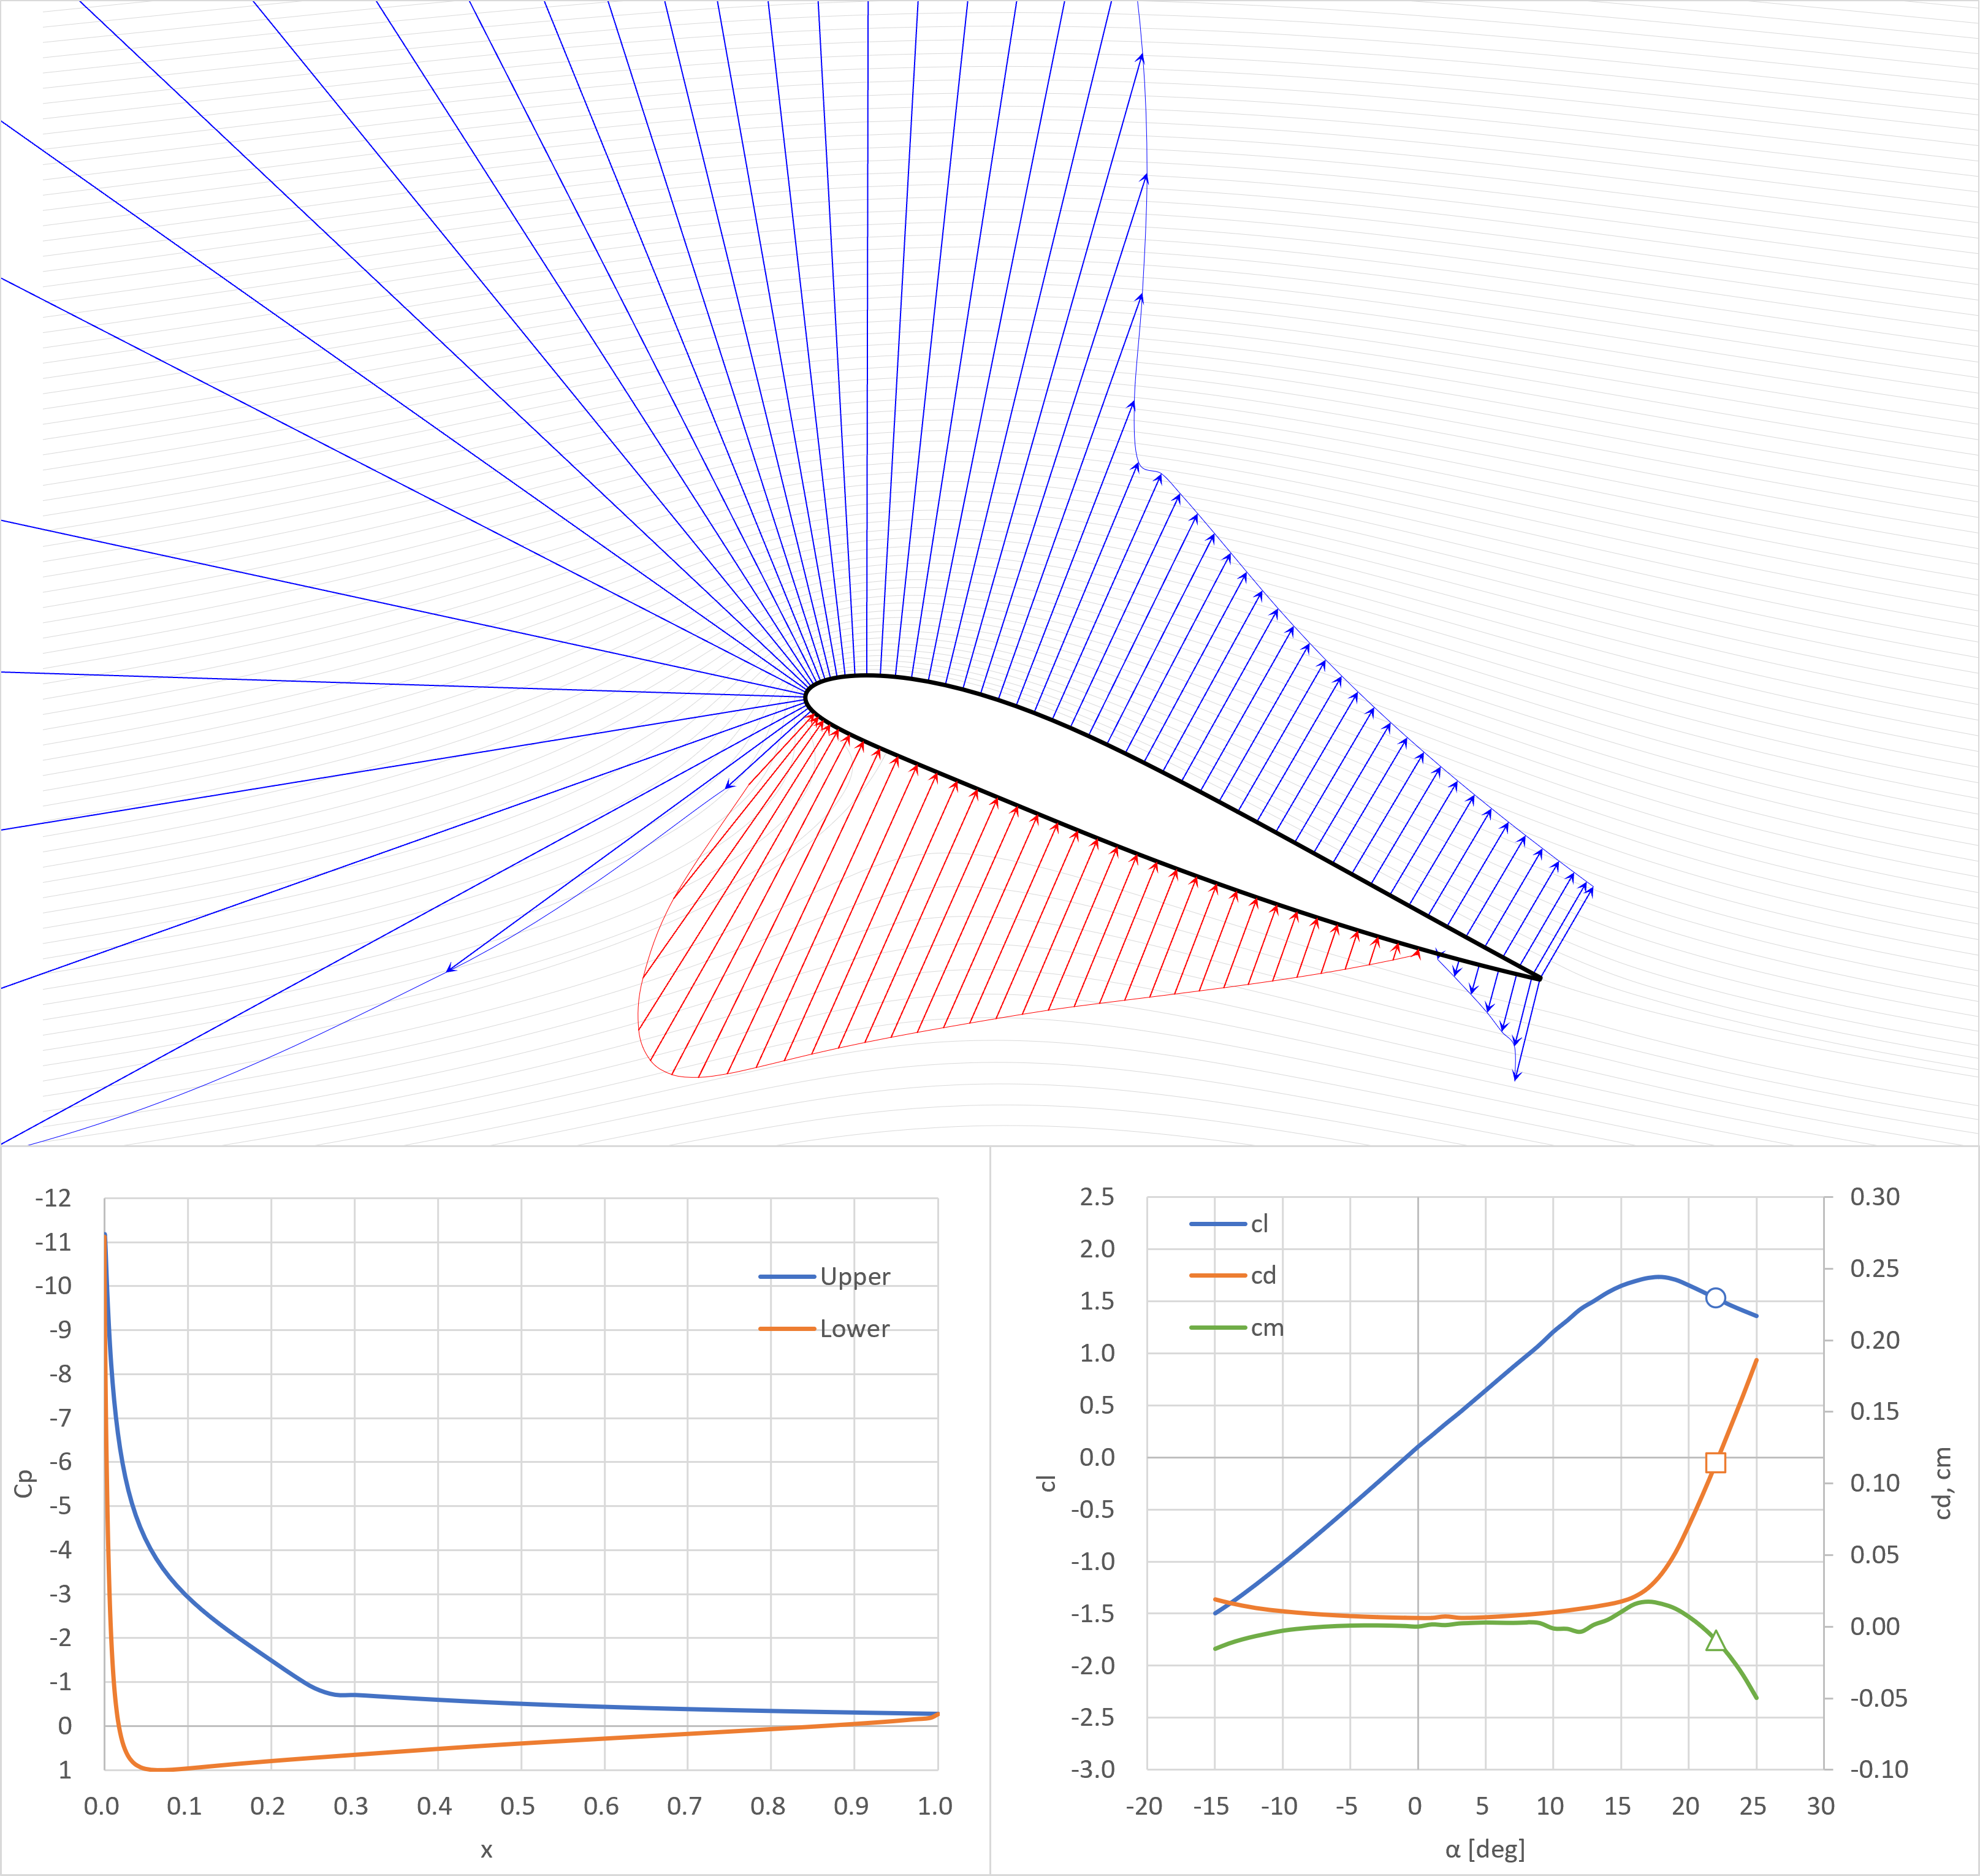
超臨界翼(SC(2)-0410)
XFOIL解析条件
- Re=1E7
- Mach=0
- xtr=(0,0) ※前縁で強制遷移
ゼロ揚力角
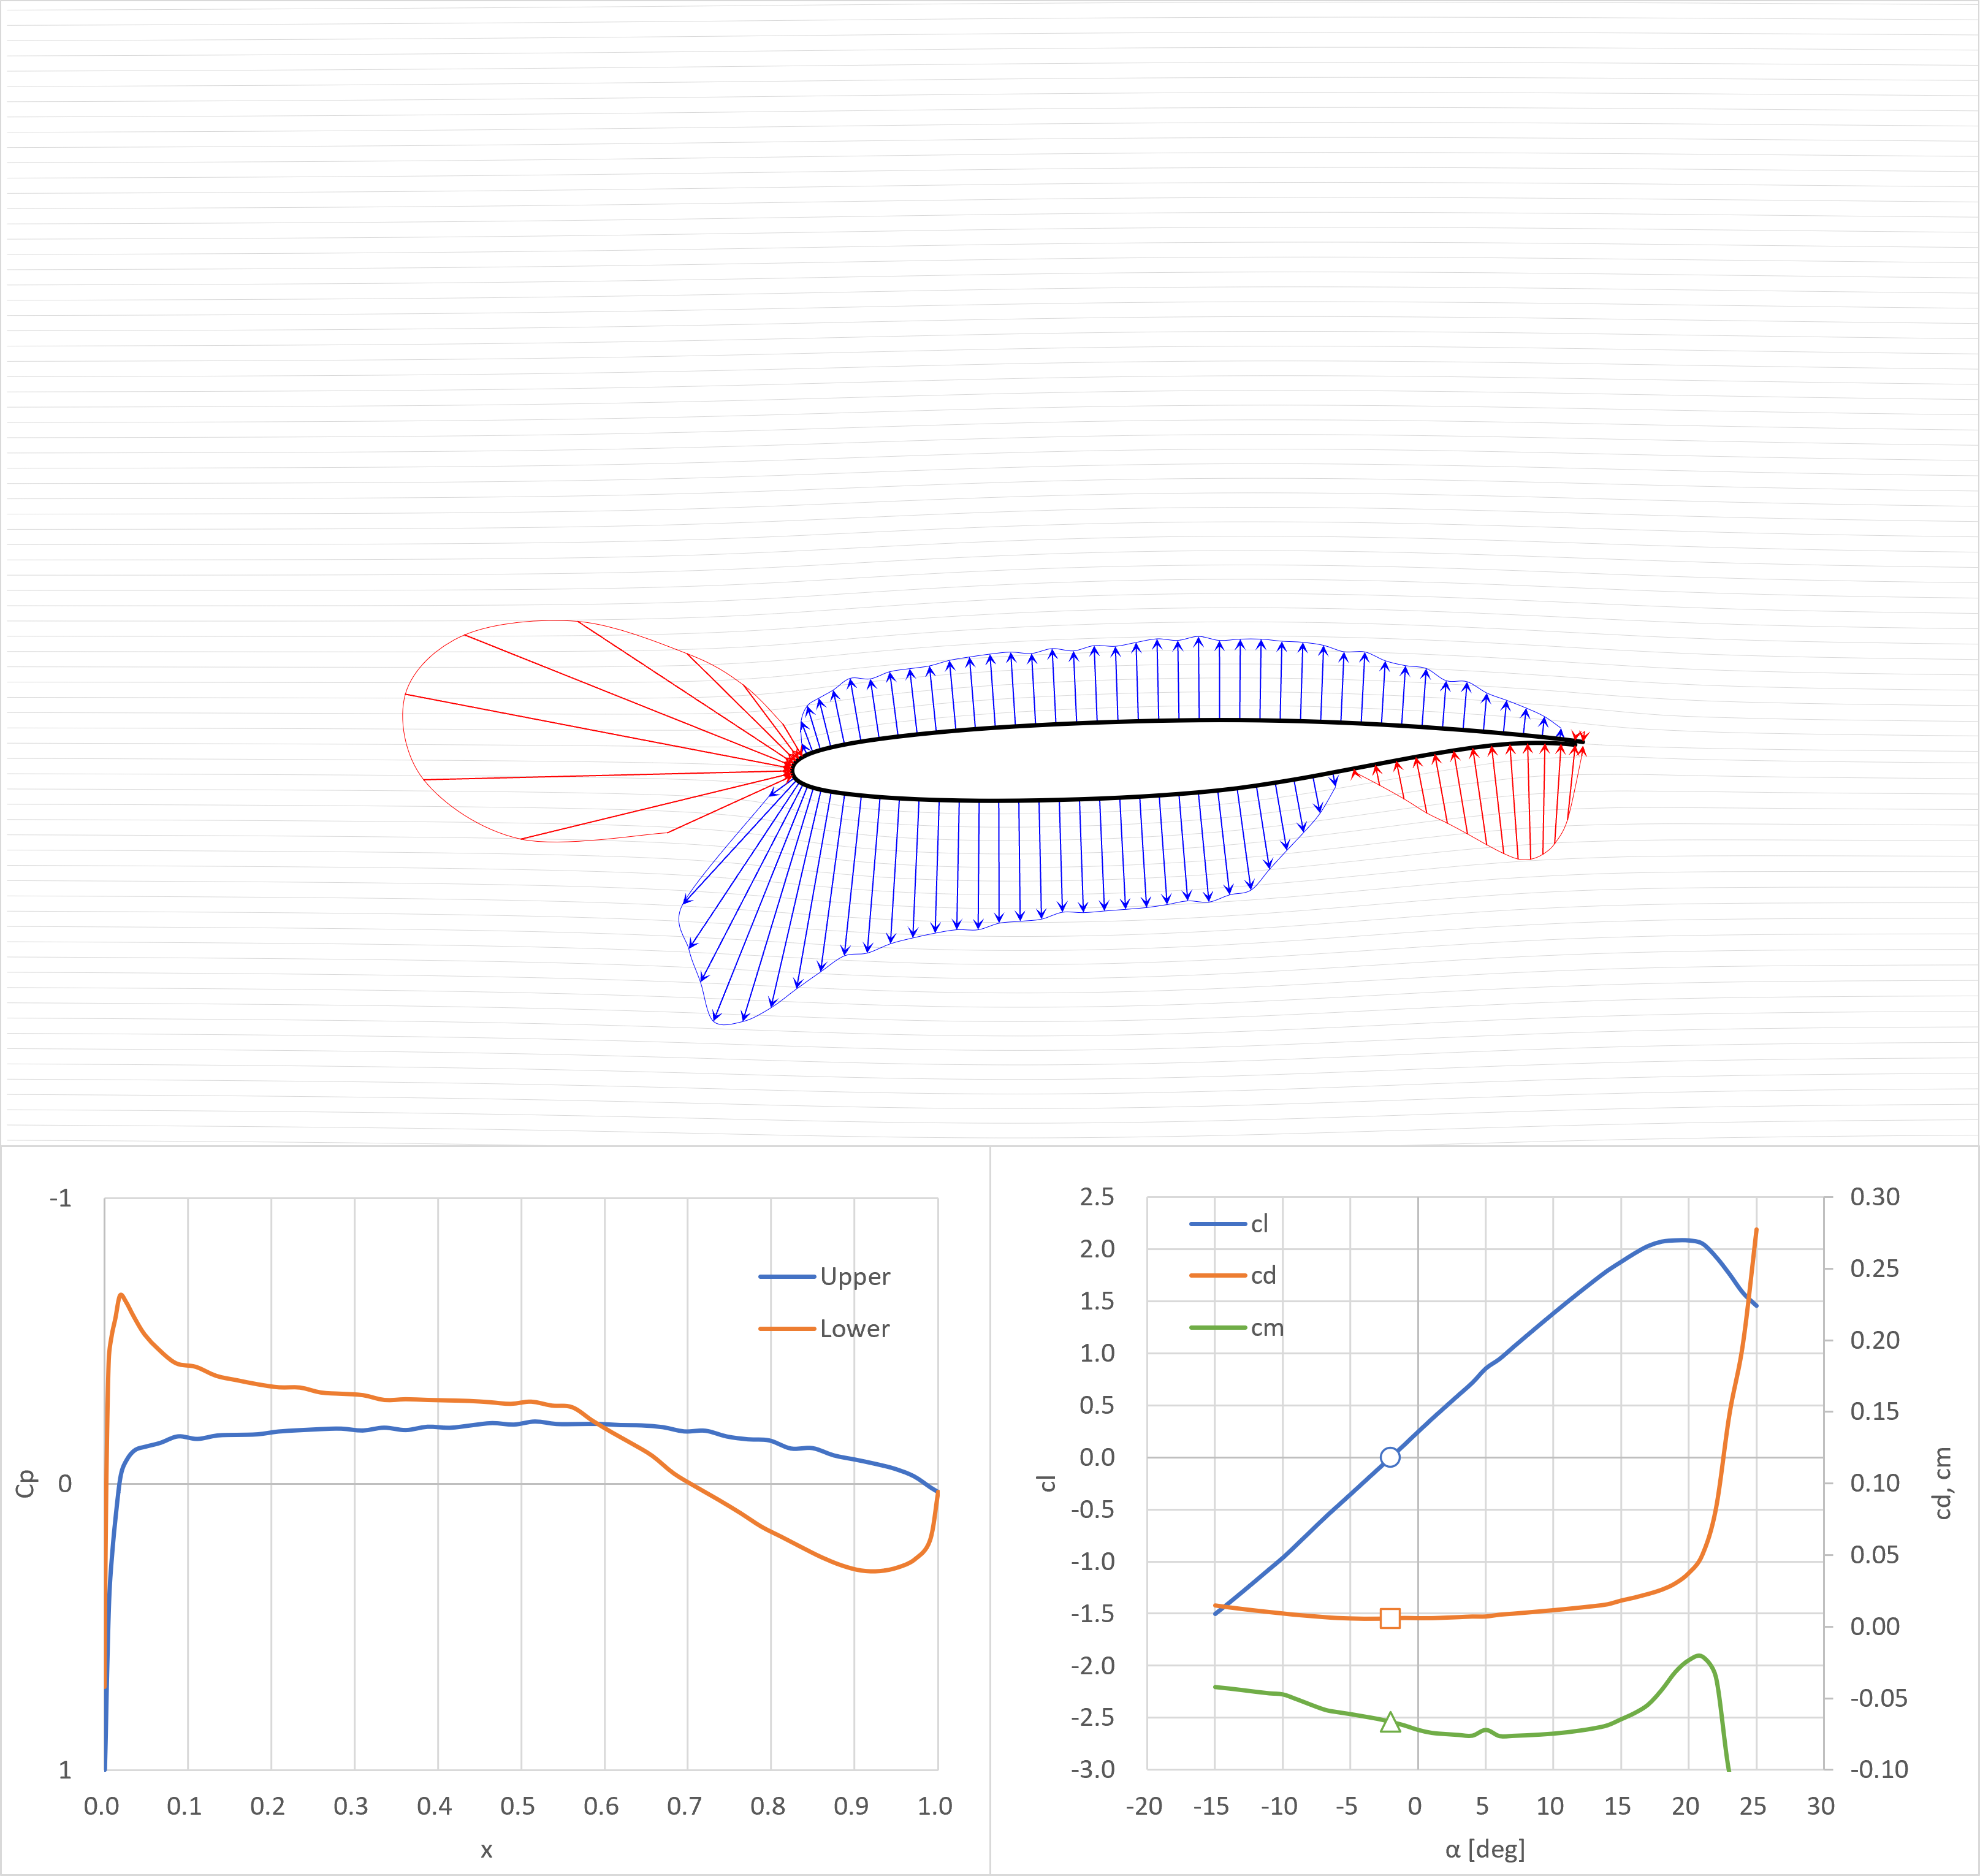
cl=0.5
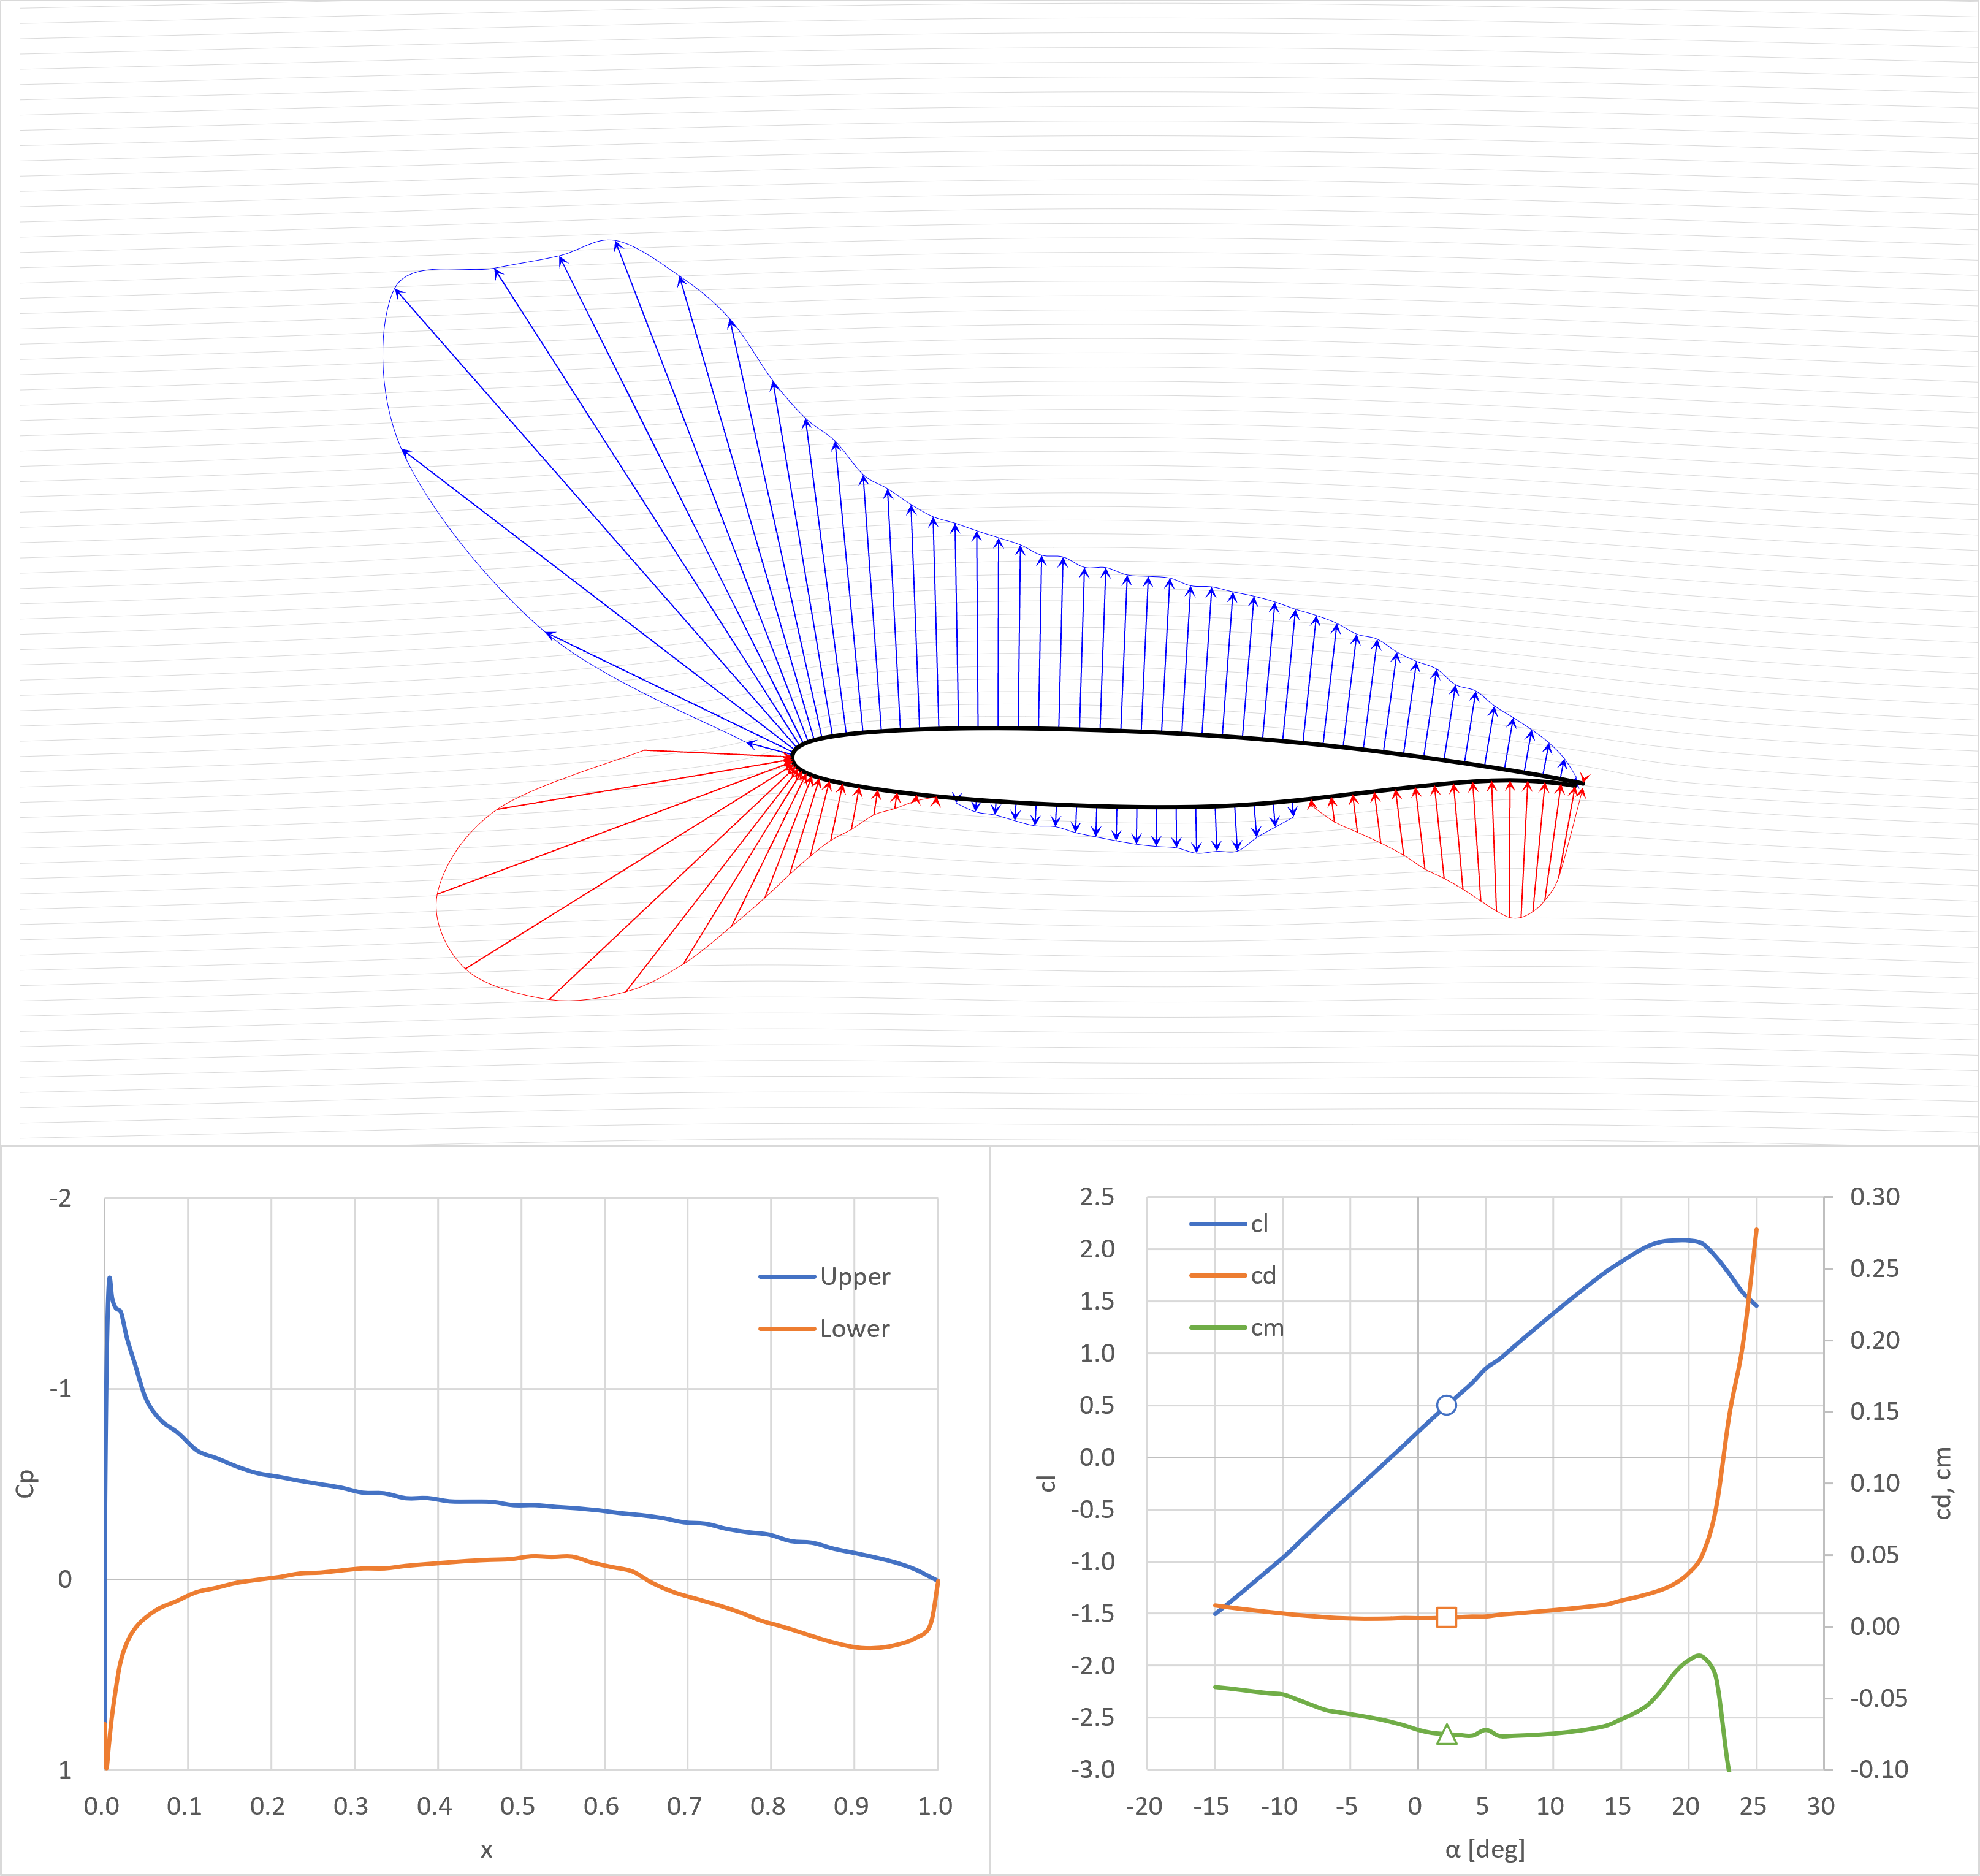
- 翼上面では平らな圧力分布
- 翼後縁下面側で大きな揚力を生じている
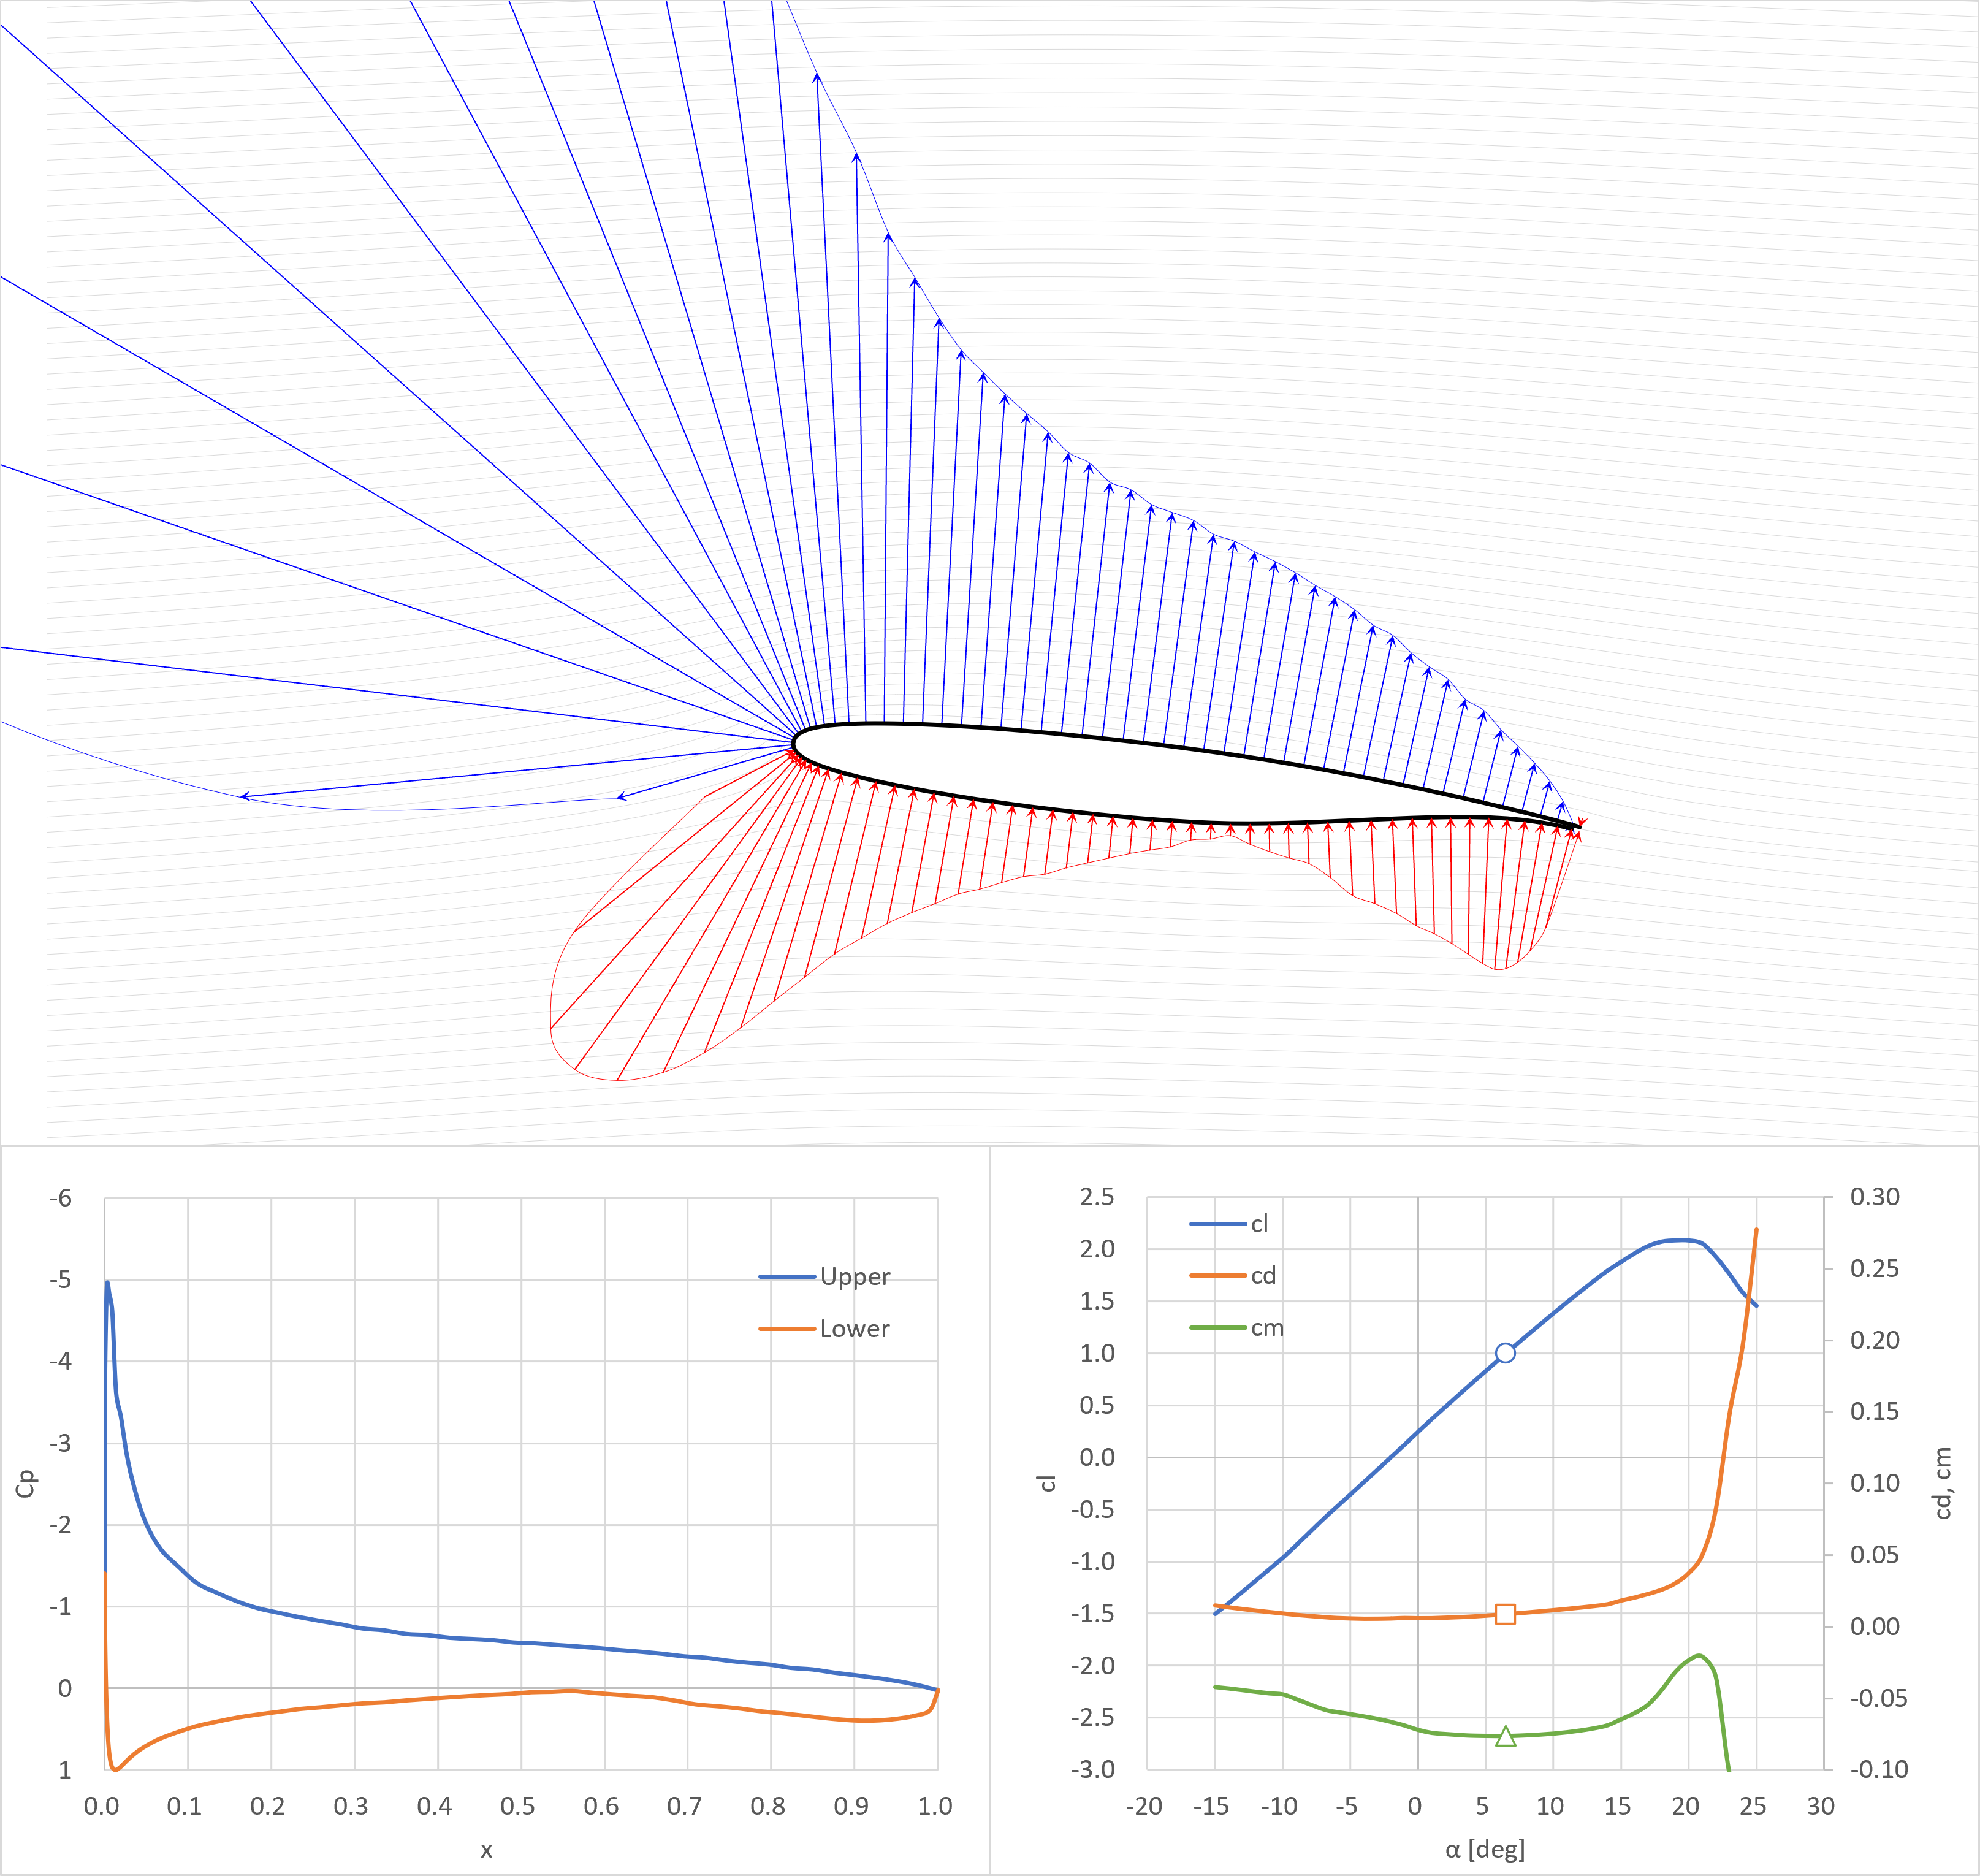
cl=1.0
失速角
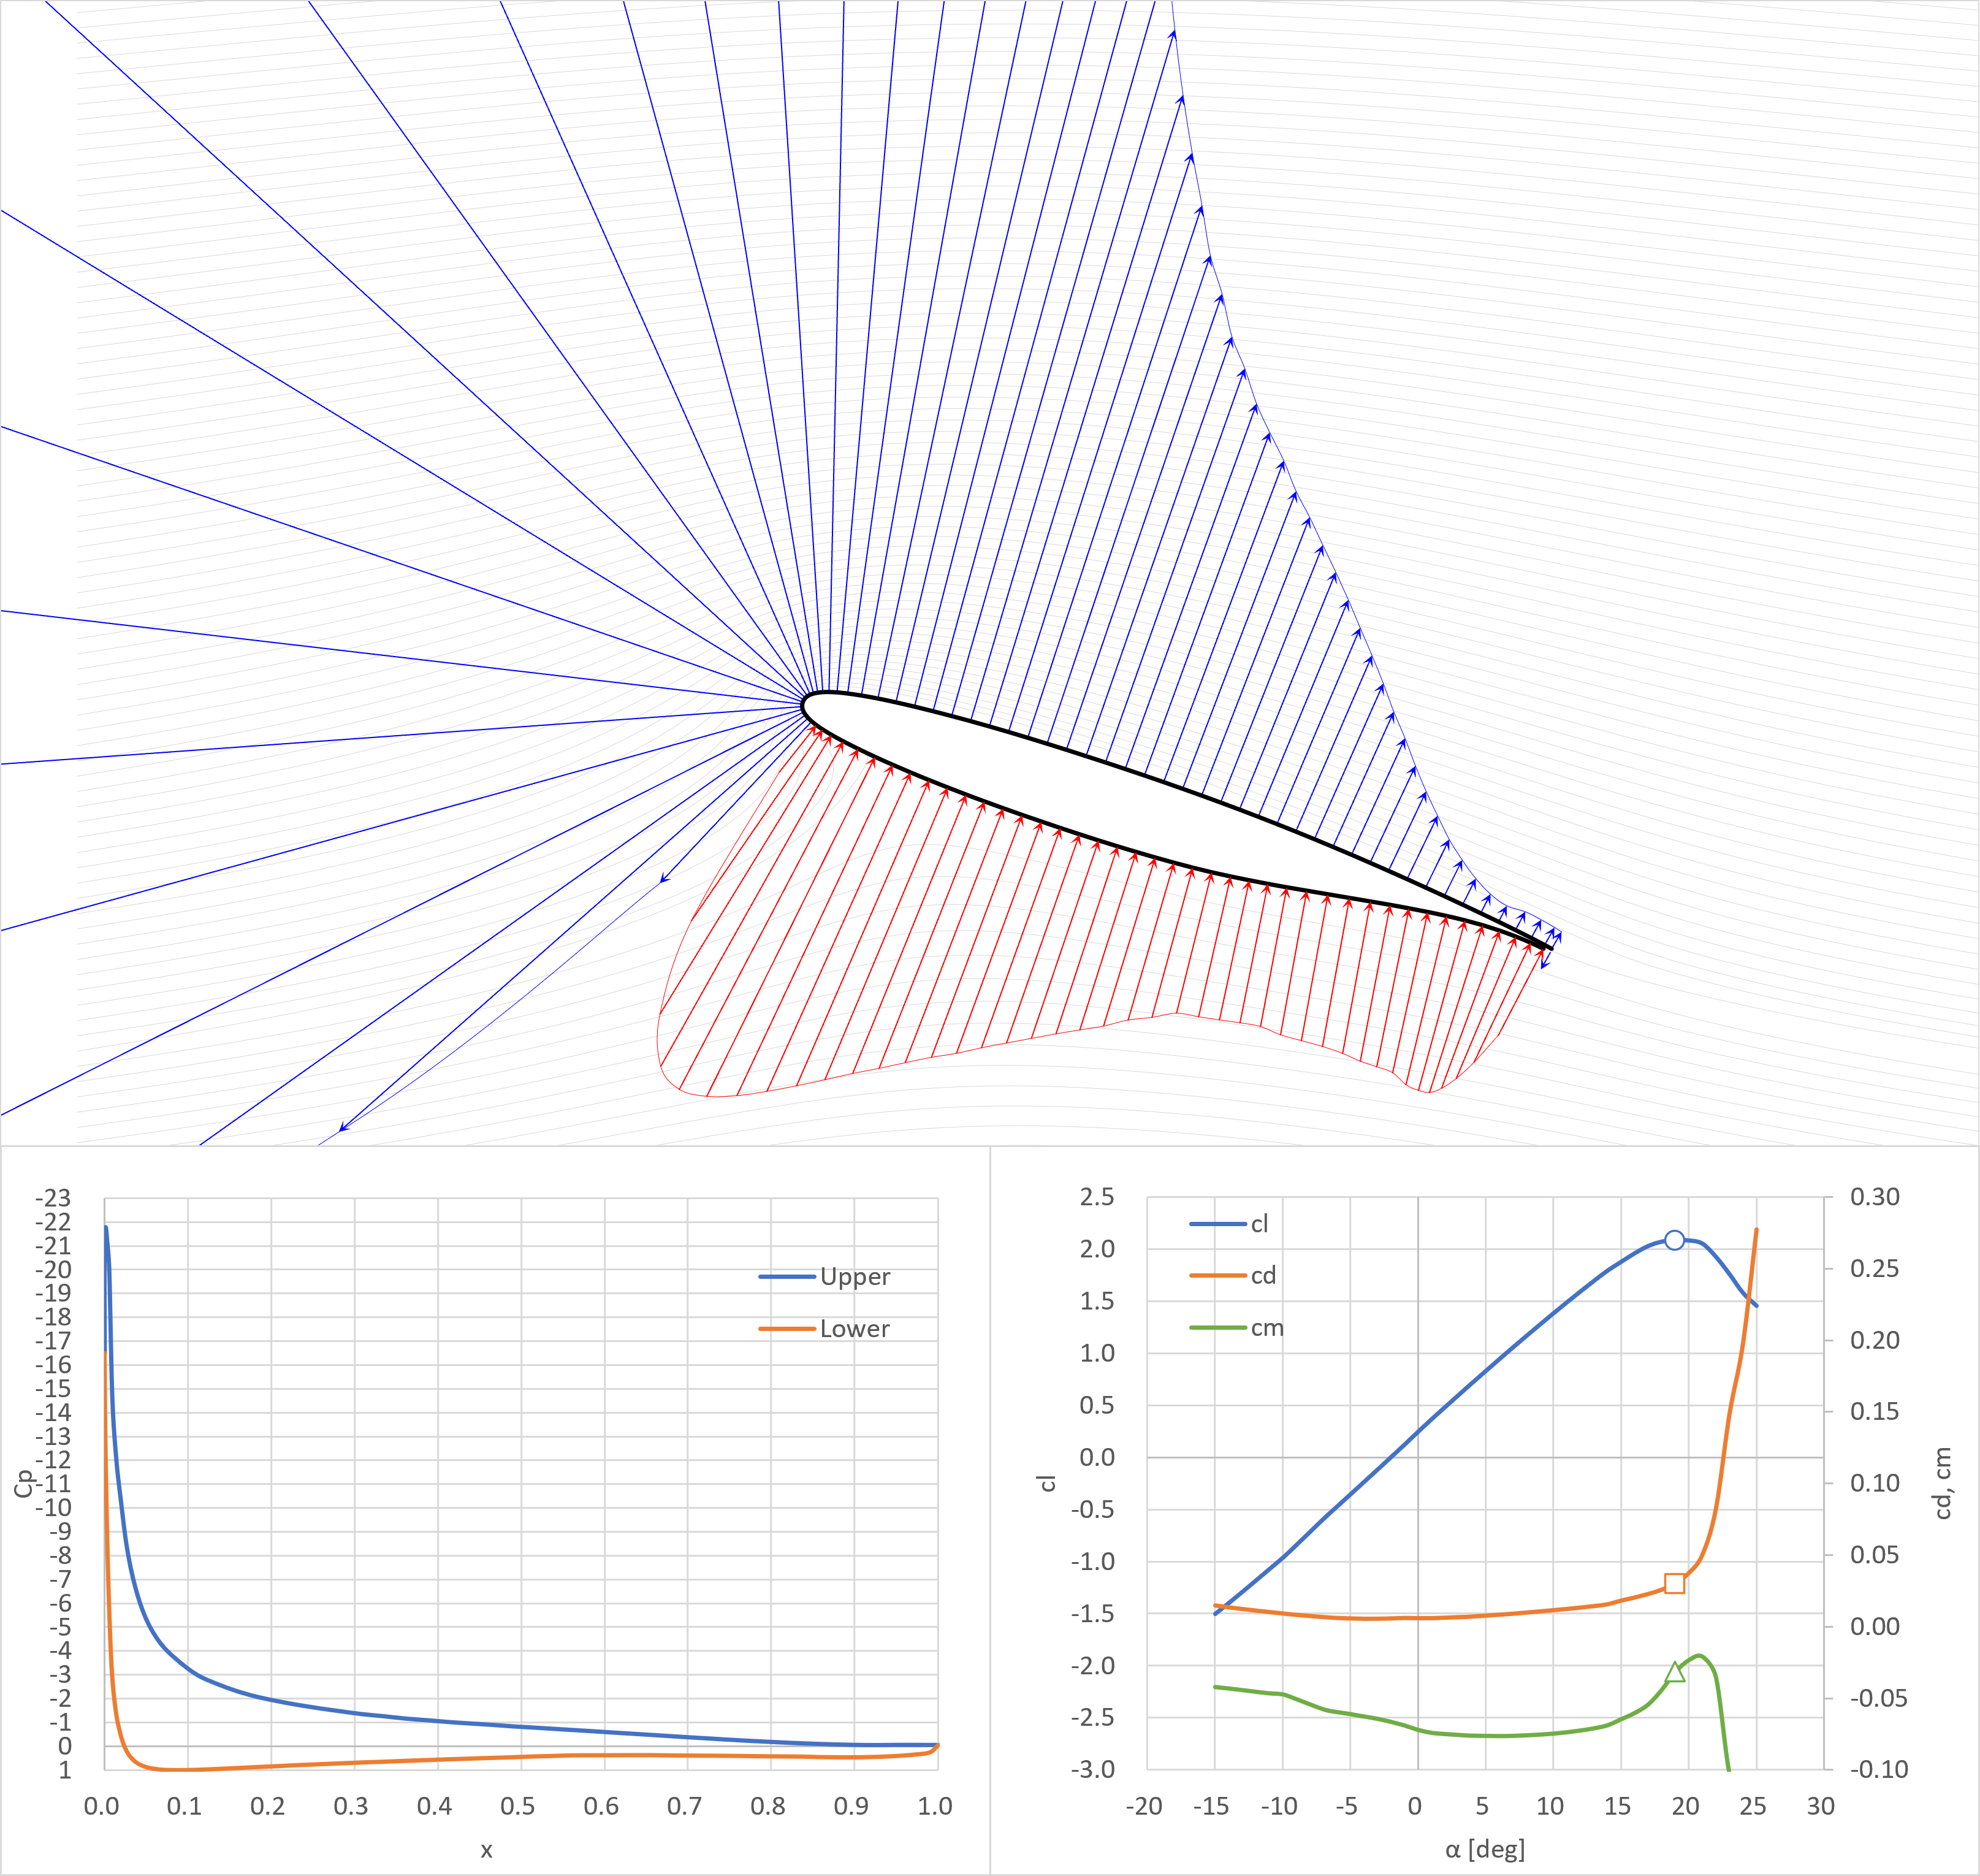
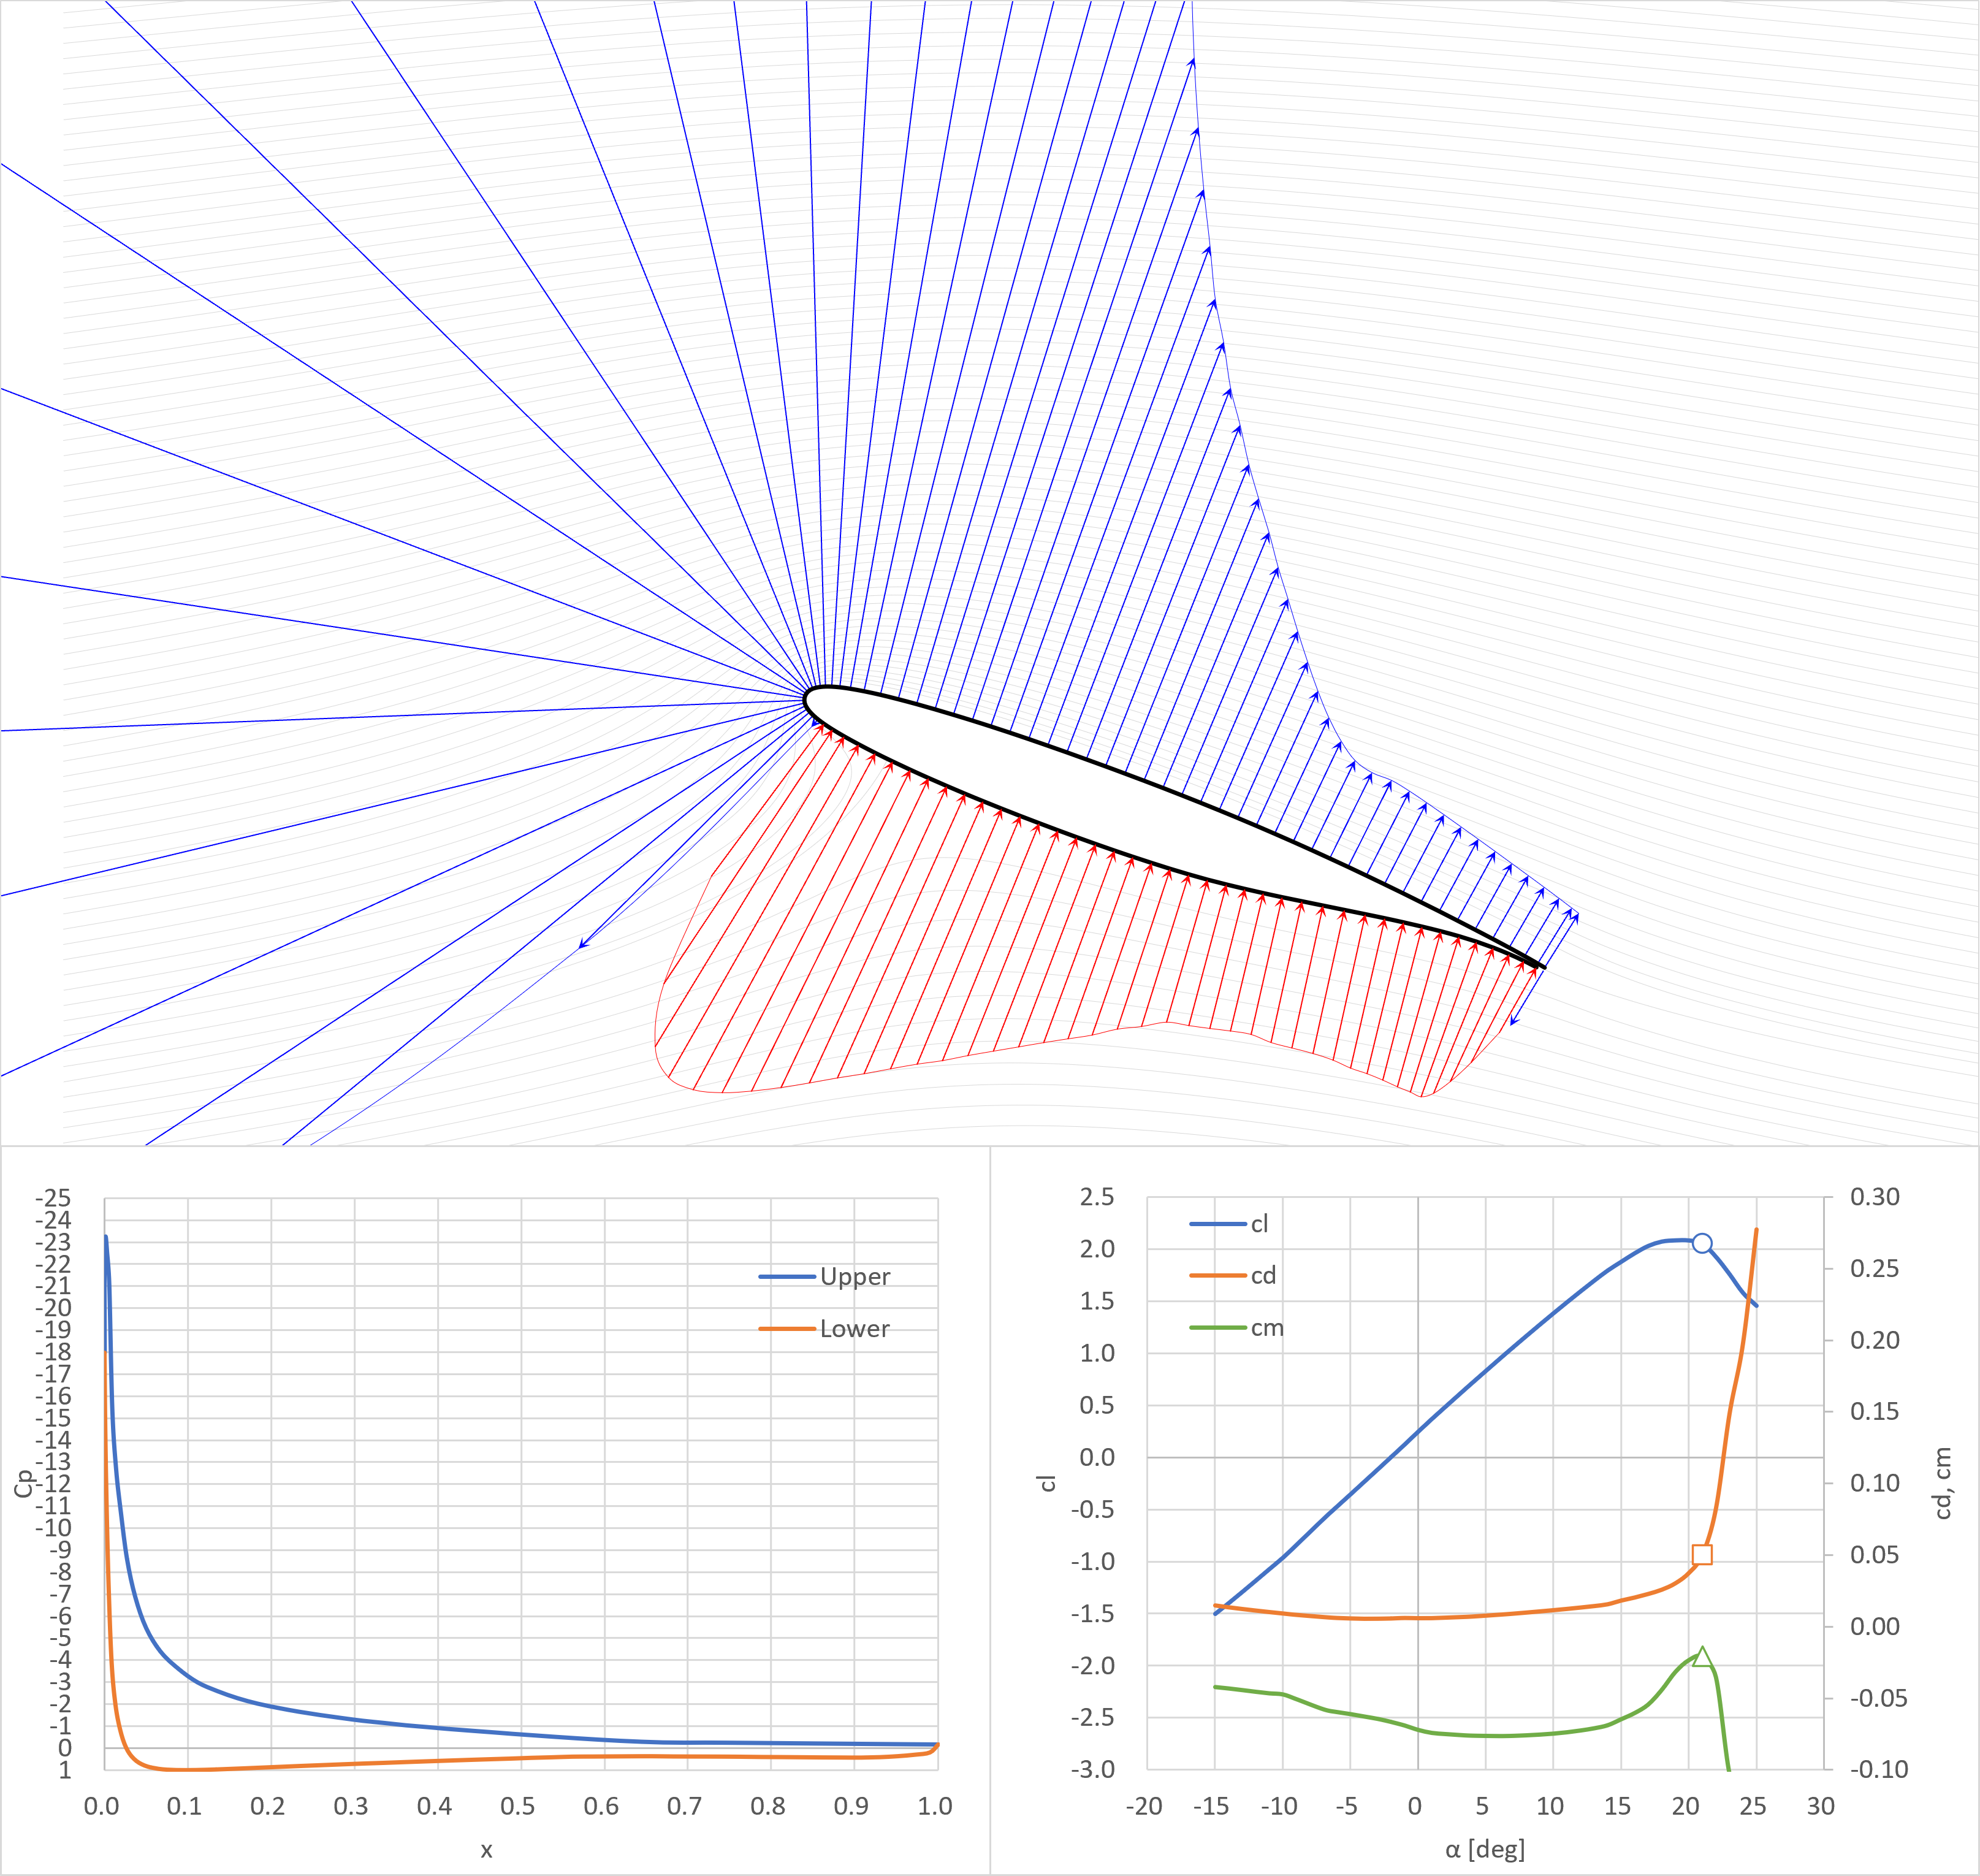
失速角+2°
おわりに
翼型の圧力分布を理解するために、いろいろな翼型の圧力分布を紹介した
↓圧力分布の表示に使ったExcelマクロはこれ
↓マクロはこれ
Const pi As Double = 3.14159265358979
Const rad As Double = pi / 180
Sub Main()
    ' 定数
    Const U0 As Double = 1#
    Const OutputFile_name As String = "Output.txt"
    Const title As String = "Cm vs alpha"
    ' 変数
    Dim z_foil() As Variant
    Dim foil_name As String
    Dim file_name As String
    Dim alpha As Variant
    Dim da As Double
    Dim nodes As Long
    Dim n As Long

    ' フォイルのサイズを確認し、z_foilを取得
    With Sheets("dat")
        dat = .Range(.Range("A2:B2"), .Range("A2:B2").End(xlDown))
    End With
    nodes = UBound(dat, 1) - 1

    ' Airfoilの読み込み
    ReDim z_foil(1 To nodes + 1, 1 To 1) As Variant

    For n = 1 To nodes + 1
        x = dat(n, 1)
        y = dat(n, 2)
        z_foil(n, 1) = Application.Complex(x, y)
    Next n

    ' 出力ファイルをリニューアル
    With Sheets("BEM_gamma")
        .Range(.Range(.Range("C6"), .Range("C6").End(xlDown)), .Range(.Range("C6"), .Range("C6").End(xlDown)).End(xlToRight)).ClearContents
        .Range(.Range("D1:D3"), .Range("D1:D3").End(xlToRight)).ClearContents
    End With

    With Sheets("BEM")
        .Range(.Range(.Range("C6"), .Range("C6").End(xlDown)), .Range(.Range("C6"), .Range("C6").End(xlDown)).End(xlToRight)).ClearContents
        .Range(.Range("D2:D4"), .Range("D2:D4").End(xlToRight)).ClearContents
        alpha = .Range(.Range("D1"), .Range("D1").End(xlToRight))
    End With

    ' 処理ループ
    For n = 1 To UBound(alpha, 2)
        da = alpha(1, n)
        Call Analize_foil(z_foil, U0, da, n - 1)
    Next n

End Sub

Sub Analize_foil(z_foil() As Variant, U0 As Double, alpha As Double, cnt As Long)
    'Application.ScreenUpdating = False

    ' 定数
    Const kmax As Integer = 40 ' ストリームラインの数
    Const xmin As Double = -0.5
    Const xmax As Double = 1.5
    Const ymin As Double = -0.5
    Const ymax As Double = 0.5 ' グラフの範囲
    Dim title As String ' タイトル
    Dim U_inf As Variant ' 一様流
    Dim z_qtr As Double '25%c

    ' 変数
    Dim S1() As Variant
    Dim S2() As Variant
    Dim l() As Double
    Dim z_ref() As Variant
    Dim zWall As Variant
    Dim Cp() As Double
    Dim A() As Double
    Dim B() As Double
    Dim gamma() As Variant
    Dim Cl As Double ' 揚力係数
    Dim Cm As Double ' ピッチングモーメント係数
    Dim i As Integer, j As Integer, k As Integer, n As Integer

    nodes = UBound(z_foil, 1) - 1

    With Application.WorksheetFunction

        ' 一様流の計算
        U_inf = Application.Complex(U0 * Cos(alpha * rad), -U0 * Sin(alpha * rad))
        z_qtr = Application.Complex(0.25, 0)

        '*************************************************
        ' S1とS2の作成
        ReDim S1(1 To nodes, 1 To nodes)
        ReDim S2(1 To nodes, 1 To nodes)
        ReDim l(1 To nodes)
        ReDim z_ref(1 To nodes)

        ' Make l & z_ref
        For i = 1 To nodes
            l(i) = .ImAbs(.ImSub(z_foil(i + 1, 1), z_foil(i, 1)))
            z_ref(i) = .ImDiv(.ImSum(z_foil(i, 1), z_foil(i + 1, 1)), 2)
        Next i

        ' Make S1 & S2
        For k = 1 To nodes
            For j = 1 To nodes
                S1(k, j) = .ImProduct(.ImDiv(Application.Complex(0, l(j)), .ImProduct(2 * pi, .ImSub(z_foil(j + 1, 1), z_foil(j, 1)))), .ImSum(-1, .ImProduct(.ImDiv(.ImSub(z_foil(j + 1, 1), z_ref(k)), .ImSub(z_foil(j + 1, 1), z_foil(j, 1))), .ImLn(.ImDiv(.ImSub(z_foil(j + 1, 1), z_ref(k)), .ImSub(z_foil(j, 1), z_ref(k)))))))
                S2(k, j) = .ImProduct(.ImDiv(Application.Complex(0, l(j)), .ImProduct(2 * pi, .ImSub(z_foil(j + 1, 1), z_foil(j, 1)))), .ImSub(1, .ImProduct(.ImDiv(.ImSub(z_foil(j + 0, 1), z_ref(k)), .ImSub(z_foil(j + 1, 1), z_foil(j, 1))), .ImLn(.ImDiv(.ImSub(z_foil(j + 1, 1), z_ref(k)), .ImSub(z_foil(j, 1), z_ref(k)))))))
            Next j
        Next k
        '*************************************************

        ' AとBの作成
        ReDim A(1 To nodes + 1, 1 To nodes + 1)
        ReDim B(1 To nodes + 1, 1 To 1)
        ReDim z_n(1 To nodes) As Variant

        ' Make z_n
        For i = 1 To nodes
            z_n(i) = .ImDiv(.ImSub(z_foil(i + 1, 1), z_foil(i, 1)), Application.Complex(0, l(i)))
        Next i

        ' Make A
        For k = 1 To nodes + 1
            For j = 1 To nodes + 1
                If k < nodes + 1 Then
                    If j = 1 Then
                        A(k, j) = .ImReal(.ImProduct(S1(k, j), z_n(k)))
                    ElseIf j = nodes + 1 Then
                        A(k, j) = .ImReal(.ImProduct(S2(k, j - 1), z_n(k)))
                    Else
                        A(k, j) = .ImReal(.ImProduct(.ImSum(S2(k, j - 1), S1(k, j)), z_n(k)))
                    End If
                Else
                    A(k, j) = 0
                End If
            Next j
        Next k

        For k = 1 To nodes
            B(k, 1) = -.ImReal(.ImProduct(U_inf, z_n(k)))
        Next k

         ' Kutta条件
        A(nodes + 1, 1) = 1
        A(nodes + 1, nodes + 1) = 1
        B(nodes + 1, 1) = 0

        '方程式を解く
        'ReDim gamma(1 To nodes + 1)
        gamma = .MMult(.MInverse(A), B)

        ' Cpの計算
        ReDim Cp(1 To nodes + 1) As Double

        For n = 1 To nodes
            zWall = .ImSum(z_ref(n), .ImProduct(z_n(n), l(n), 0.00001))
            uv = Make_uv(zWall, U_inf, z_foil, gamma)
            u = .ImAbs(uv)
            U0 = .ImAbs(U_inf)
            Cp(n) = (1 - (u / U0) * (u / U0))
        Next n

        ' Cl, Cmの計算
        Cl = 0
        Cm = 0
        For n = 1 To nodes
            theta = .ImArgument(.ImSub(z_foil(n + 1, 1), z_foil(n, 1)))
            pn = Cp(n) * l(n) * Cos(theta)
            pt = -Cp(n) * l(n) * Sin(theta)
            x = .ImReal(.ImSub(z_ref(n), z_qtr))
            y = .Imaginary(.ImSub(z_ref(n), z_qtr))
            Cl = Cl + pn * Cos(rad * alpha) - pt * Sin(rad * alpha)
            Cm = Cm - pn * x + pt * y
        Next n

    End With

    With Sheets("BEM")

        '.Cells(1, 4 + cnt) = alpha
        .Cells(2, 4 + cnt) = Cl
        .Cells(3, 4 + cnt) = 0
        .Cells(4, 4 + cnt) = Cm

        .Range(.Cells(6, 3), .Cells(6 + nodes - 1, 3)) = WorksheetFunction.Transpose(z_ref)
        .Range(.Cells(6, 4 + cnt), .Cells(6 + nodes - 1, 4 + cnt)) = WorksheetFunction.Transpose(Cp)

    End With

    With Sheets("BEM_gamma")

        '.Cells(1, 4 + cnt) = alpha
        .Cells(2, 4 + cnt) = Cl
        .Cells(3, 4 + cnt) = 0
        .Cells(3, 4 + cnt) = Cm

        .Range(.Cells(6, 3), .Cells(6 + nodes, 3)) = z_foil
        .Range(.Cells(6, 4 + cnt), .Cells(6 + nodes, 4 + cnt)) = gamma

    End With

    'Application.ScreenUpdating = True
End Sub
Function Make_uv(z_ref As Variant, U_inf As Variant, z_foil As Variant, gamma As Variant) As Variant

    Dim S1_uv() As Variant
    Dim S2_uv() As Variant
    Dim l() As Variant
    Dim k As Integer

    nodes = UBound(z_foil, 1) - 1

    ReDim S1_uv(1 To nodes) As Variant
    ReDim S2_uv(1 To nodes) As Variant
    ReDim l(1 To nodes)

    With Application.WorksheetFunction

        ' Make l & z_ref
        For i = 1 To nodes
            l(i) = .ImAbs(.ImSub(z_foil(i + 1, 1), z_foil(i, 1)))
        Next i

        ' Make S1 & S2
        For k = 1 To nodes
            S1_uv(k) = .ImProduct(.ImDiv(Application.Complex(0, l(k)), .ImProduct(2 * pi, .ImSub(z_foil(k + 1, 1), z_foil(k, 1)))), .ImSum(-1, .ImProduct(.ImDiv(.ImSub(z_foil(k + 1, 1), z_ref), .ImSub(z_foil(k + 1, 1), z_foil(k, 1))), .ImLn(.ImDiv(.ImSub(z_foil(k + 1, 1), z_ref), .ImSub(z_foil(k, 1), z_ref))))))
            S2_uv(k) = .ImProduct(.ImDiv(Application.Complex(0, l(k)), .ImProduct(2 * pi, .ImSub(z_foil(k + 1, 1), z_foil(k, 1)))), .ImSub(1, .ImProduct(.ImDiv(.ImSub(z_foil(k + 0, 1), z_ref), .ImSub(z_foil(k + 1, 1), z_foil(k, 1))), .ImLn(.ImDiv(.ImSub(z_foil(k + 1, 1), z_ref), .ImSub(z_foil(k, 1), z_ref))))))
        Next k

        ' eq.(4.42)
        uv = .ImSum(U_inf, .ImProduct(S1_uv(1), gamma(1, 1)), .ImProduct(S2_uv(nodes), gamma(nodes + 1, 1)))
        For k = 2 To nodes
            uv = .ImSum(uv, .ImProduct(.ImSum(S1_uv(k), S2_uv(k - 1)), gamma(k, 1)))
        Next k

    End With

    Make_uv = uv

End Function
Sub plotStreamline()

    ' 定数
    Const U0 As Double = 1
    Const dy As Double = 0.02
    Const xmin As Double = -1
    Const xmax As Double = 2.5
    Const ymin As Double = -0.7
    Const ymax As Double = 1 ' グラフの範囲
    Dim U_inf As Variant ' 一様流
    Dim z_qtr As Double '25%c
    Dim sht As Worksheet

    Dim l() As Variant
    Dim z_n() As Variant
    Dim z_foil As Variant
    Dim z_ref As Variant
    Dim zStart As Variant
    Dim zStag As Variant
    Dim Cp As Variant
    Dim x As Variant
    Dim gamma As Variant
    Dim alpha As Double
    Dim nStag As Long
    Dim xy As Variant

    Set sht = Worksheets("Streamline")
    U_inf = Application.Complex(U0, 0) 'Application.Complex(U0 * Cos(alpha * rad), -U0 * Sin(alpha * rad))
    z_qtr = Application.Complex(0.25, 0)
    nCol = 5

    With Sheets("BEM_gamma")
        z_foil = .Range(.Cells(6, 3), .Cells(6, 3).End(xlDown))
        gamma = .Range(.Cells(6, 3 + nCol), .Cells(6, 3 + nCol).End(xlDown))
        'x = .Range(.Cells(6, 1), .Cells(6, 1).End(xlDown))
    End With
    With Sheets("BEM")
        Cp = .Range(.Cells(6, 3 + nCol), .Cells(6, 3 + nCol).End(xlDown))
        alpha = .Cells(1, 3 + nCol)
    End With
    sht.Range("D6:E99999").ClearContents

    With WorksheetFunction

        nodes = UBound(z_foil, 1) - 1
        ReDim l(1 To nodes)
        ReDim z_n(1 To nodes)
        ReDim z_ref(1 To nodes)

        For i = 1 To UBound(z_foil, 1)
            z_foil(i, 1) = .ImSum(.ImProduct(.ImSub(z_foil(i, 1), z_qtr), .Complex(Cos(-rad * alpha), Sin(-rad * alpha))), z_qtr)
        Next i

        ' Make l & z_ref
        For i = 1 To nodes
            l(i) = .ImAbs(.ImSub(z_foil(i + 1, 1), z_foil(i, 1)))
            z_ref(i) = .ImDiv(.ImSum(z_foil(i, 1), z_foil(i + 1, 1)), 2)
            z_n(i) = .ImDiv(.ImSub(z_foil(i + 1, 1), z_foil(i, 1)), Application.Complex(0, l(i)))
        Next i

        sht.Cells(1, 4 + cnt) = alpha
        sht.Range(sht.Cells(6, 3), sht.Cells(6 + nodes, 3)) = z_foil
        nRow = 0

        nStag = .Match(.Max(Cp), Cp, 0)
        zStag = .ImSum(z_ref(nStag), .ImProduct(z_n(nStag), l(nStag), 0.01))
        zStart = zStag
        xy = streamline(U_inf, zStart, z_foil, gamma, xmin, zStag)
        sht.Range(sht.Cells(6 + nRow, 4), sht.Cells(6 + nRow + UBound(xy, 1) - 1, 5)) = xy
        nRow = nRow + UBound(xy, 1) + 1

        x = xy(UBound(xy, 1), 1)
        y = xy(UBound(xy, 1), 2)

        zStart = .ImDiv(.ImSum(z_foil(1, 1), z_foil(nodes + 1, 1)), 2)
        xy = streamline(U_inf, zStart, z_foil, gamma, xmax, zStart)
        sht.Range(sht.Cells(6 + nRow, 4), sht.Cells(6 + nRow + UBound(xy, 1) - 1, 5)) = xy
        nRow = nRow + UBound(xy, 1) + 1

        n = 0
        Do While y > ymin
            y = y - dy
            zStart = .Complex(x, y)
            xy = streamline(U_inf, zStart, z_foil, gamma, xmax, zStag)
            sht.Range(sht.Cells(6 + nRow, 4), sht.Cells(6 + nRow + UBound(xy, 1) - 1, 5)) = xy
            nRow = nRow + UBound(xy, 1) + 1
            n = n + 1
        Loop
        y = y + dy * (n + 0)
        Do While y < ymax
            y = y + dy
            zStart = .Complex(x, y)
            xy = streamline(U_inf, zStart, z_foil, gamma, xmax, zStag)
            sht.Range(sht.Cells(6 + nRow, 4), sht.Cells(6 + nRow + UBound(xy, 1) - 1, 5)) = xy
            nRow = nRow + UBound(xy, 1) + 1
            n = n + 1
        Loop

    End With

End Sub
Function streamline(U_inf As Variant, zStart As Variant, z_foil As Variant, gamma As Variant, xlimit As Double, zStag As Variant) As Variant

    Const dt0 As Double = 0.1
    Const dtheta_max As Double = 100000
    Dim uv As Variant
    Dim z_ref As Variant
    Dim x, y As Double
    Dim u, v As Double
    Dim dt As Double
    Dim theta, theta0, dtheta As Double
    Dim tmp(1 To 9999, 1 To 2) As Variant
    Dim pm As Double

    With WorksheetFunction
        pm = (xlimit - .ImReal(zStart)) / Abs(xlimit - .ImReal(zStart))

        z_ref = zStart
        x = .ImReal(z_ref)
        y = .Imaginary(z_ref)
        n = 0
        dt = dt0
        Do While (xlimit - x) / pm > 0
            n = n + 1
            tmp(n, 1) = x
            tmp(n, 2) = y
            uv = Make_uv(z_ref, U_inf, z_foil, gamma)
            u = .ImReal(uv)
            v = -.Imaginary(uv)
            dt = dt0 * (0.01 + (.Min(.ImAbs(.ImSub(z_ref, zStag)), 1) / .ImAbs(uv)) ^ 2)
            x = x + u * dt * pm
            y = y + v * dt * pm
            z_ref = .Complex(x, y)
        Loop
    End With

    ReDim xy(1 To n, 1 To 2)
    For i = 1 To n
        xy(i, 1) = tmp(i, 1)
        xy(i, 2) = tmp(i, 2)
    Next i

    streamline = xy

End Function


コメント