gmshで作成したメッシュを用いて二次元翼解析を行い,揚力係数,抗力係数,ピッチングモーメント係数を計算する.
また,圧力係数を計算し,ParaViewで翼表面上の圧力係数を可視化・出力する
解析に使ったファイルはGithubにアップしてある.
≫mtkbirdman.com/OpenFOAM/2D_airfoil_ver2/
はじめに
前回の記事(≫【OpenFOAM v2006】二次元翼型解析)に手を加えて,空力係数の計算や圧力分布の可視化ができるようにする
変更点のみ紹介するので,詳しくは前回の記事を参考にしてほしい
モデル作成
変更なし
メッシュ作成
長くなったので別記事にまとめた
≫【gmsh v4.6.0】pythonを使って二次元翼型のメッシュを切る
条件設定
Cl,Cd,Cm,Cpを計算するためにsystem/controlDictにfunctionを加える
Function objectsについてのドキュメントはこちら
≫OpenFOAM_ User Guide_ Function objects
≫OpenFOAM_ User Guide_ Force coefficients
≫OpenFOAM_ User Guide_ pressure
ControlDict
forceCoeffs
空力係数を計算するには,functionに以下のコードを加える
    forceCoeffs
    {
        type            forceCoeffs;
        libs            (forces);
        writeControl    timeStep;
        writeinterval   1;
        log             true;

        patches         (aerofoil);
        p               p;
        U               U;
        rho             rhoInf;
        rhoInf          1;
        CofR            (0.25 0 0.5);
        liftDir         VEC_Lift;
        dragDir         VEC_Drag;
        pitchAxis       (0 0 1);
        magUInf         MAG_VEL;
        lRef            1;
        Aref            1;
    }
それぞれのオプションの意味は以下の通り
| type | function object の type name |
| libs | 実装ファイルが含まれているライブラリ名 |
| writeControl | 計算結果の出力のタイミング |
| writeInterval | 計算結果の出力の間隔 |
| log | 計算のログを出力するかどうか |
| patches | 係数を計算するときに参照するpatch |
| p | 圧力の変数の指定 |
| U | 速度の変数の指定 |
| rho | 密度の変数の指定 |
| rhoInf | rhoInfを指定したときのrhoInfの値 [kg/m^3] |
| CofR | Cmを計算するときの基準点 |
| liftDir | 揚力ベクトルの向き.Allrun.pyで入力 |
| dragDir | 抗力ベクトルの向き.Allrun.pyで入力 |
| pitchAxis | ピッチングモーメントの回転軸. |
| magUInf | 一様流速 [m/s].Allrun.pyで入力 |
| lRef | 代表長さ [m] |
| Aref | 代表面積 [m^2] |
pressure
圧力係数を計算するには,functionに以下のコードを加える
    pressure
    {
        type            pressure;
        libs            (fieldFunctionObjects);
        writeControl    onEnd;
        mode            staticCoeff;

        p               p;
        U               U;
        rho             rhoInf;
        rhoInf          1.0;
        pInf            0.0;
        UInf            VEC_VEL;
    }
それぞれのオプションの意味は以下の通り
| type | function object の type name |
| libs | 実装ファイルが含まれているライブラリ名 |
| writeControl | 計算結果の出力のタイミング |
| p | 圧力の変数の指定 |
| U | 速度の変数の指定 |
| rho | 密度の変数の指定 |
| rhoInf | rhoInfを指定したときのrhoInfの値 [kg/m^3] |
| pInf | Cpを計算するときの参照圧力 [Pa] |
| UInf | 一様流速ベクトル [m/s].Allrun.pyで入力 |
Allrun.py
設定した迎角や一様流速によってcontrolDictを書き換えられるようにAllrun.pyを変更する
def runSim(fsV,alpha):
   with open("controlDict_template", "rt") as inFile:
        with open("system/controlDict", "wt") as outFile:
            for line in inFile:
                line = line.replace("VEC_Lift","({} {} 0)".format(-math.sin(alpha),math.cos(alpha)))
                line = line.replace("VEC_Drag","({} {} 0)".format(math.cos(alpha),math.sin(alpha)))
                line = line.replace("MAG_VEL","{}".format(fsV))
                line = line.replace("VEC_VEL","({} {} 0)".format(math.cos(alpha)*fsV,math.sin(alpha)*fsV))
                outFile.write(line)
計算実行
Allrun.pyを実行する
/2D_airfoil_ver2$ python Allrun.py
Using len 10.000 alpha 0.098
Resulting freestream vel x,y: 9.952,0.980
gmsh > done!
gmshToFOAM > done!
Running simpleFoam on /mnt/c/Users/<ユーザー名>/OneDrive/Documents/OpenFOAM/2D_airfoil_ver2/airfoil
done! > time:416.050 [s]
/2D_airfoil_ver2$
だいたい10分以内に計算は終わる
ポスト処理
残差の表示
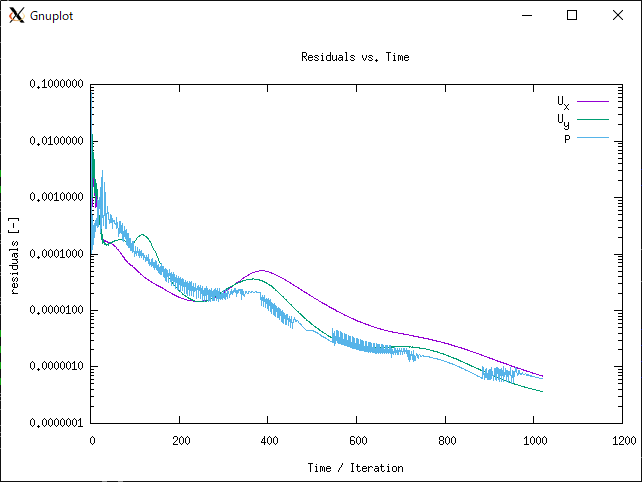
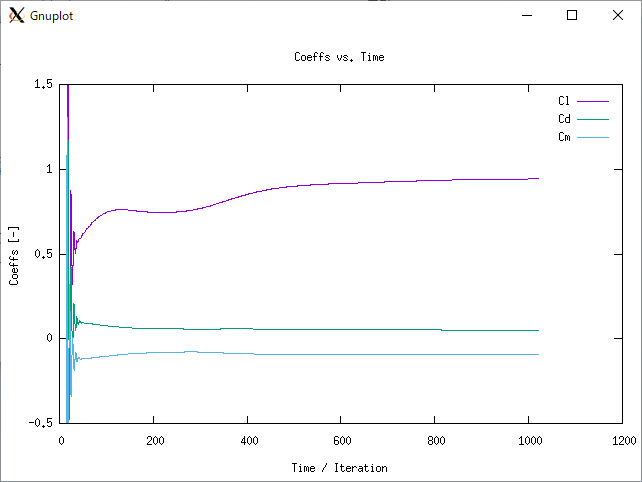
デフォルトで使用可能なfoamMonitorコマンドのグラフが見づらかったので,下の動画とソースコードを参考に残差と空力係数の推移をグラフで表示するプログラムを作成した
≫How to Plot Forces in OpenFOAM - YouTube
≫OpenFOAM_Tutorials__HowToPlotForces at master
残差と空力係数でコードはほとんど同じなので,残差を表示する方のプログラムのみ以下に示す
import os
import sys
import math

residuals_file = "airfoil/postProcessing/residuals/0/solverInfo.dat"

if not os.path.isfile(residuals_file):
	print ("Coefficient file not found at "+residuals_file)
	print ("Be sure that the case has been run and you have the right directory!")
	print ("Exiting.")
	sys.exit()

def line2dict(line):
    tokens = line.split()
    floats = [x for x in tokens]
    data_dict = {}
    data_dict['time'] = floats[0]
    coeff_dict = {}
    coeff_dict['U_x']=floats[3]
    coeff_dict['U_y']=floats[6]
    coeff_dict['p']=floats[11]
    data_dict['coeff']=coeff_dict
    return data_dict

time = []
U_x = []
U_y = []
p = []
with open(residuals_file,"r") as datafile:
	for line in datafile:
		if line[0] == "#":
			continue
		data_dict = line2dict(line)
		time += [data_dict['time']]
		U_x += [data_dict['coeff']['U_x']]
		U_y += [data_dict['coeff']['U_y']]
		p += [data_dict['coeff']['p']]
datafile.close()

outputfile = open('gnuplot_residuals.txt','w')
for i in range(0,len(time)):
	outputfile.write(str(time[i])+' '+str(U_x[i])+' '+str(U_y[i])+' '+str(p[i])+'\n')
outputfile.close()

os.system("./gnuplot_residuals.sh")
#!/bin/bash
export DISPLAY=localhost:0.0
gnuplot -persist > /dev/null 2>&1 << EOF
set terminal x11
set title "Coeffs vs. Time"
set xlabel "Time / Iteration"
set ylabel "residuals [-]"
set logscale y
plot "gnuplot_residuals.txt" using 1:2 title 'U_x' with lines,"gnuplot_residuals.txt" using 1:3 title 'U_y' with lines,"gnuplot_residuals.txt" using 1:4 title 'p' with lines
EOFこんな感じで表示される
翼表面の圧力分布の可視化・出力
paraView5.8.0を用いて翼表面の圧力分布の可視化・出力を行う
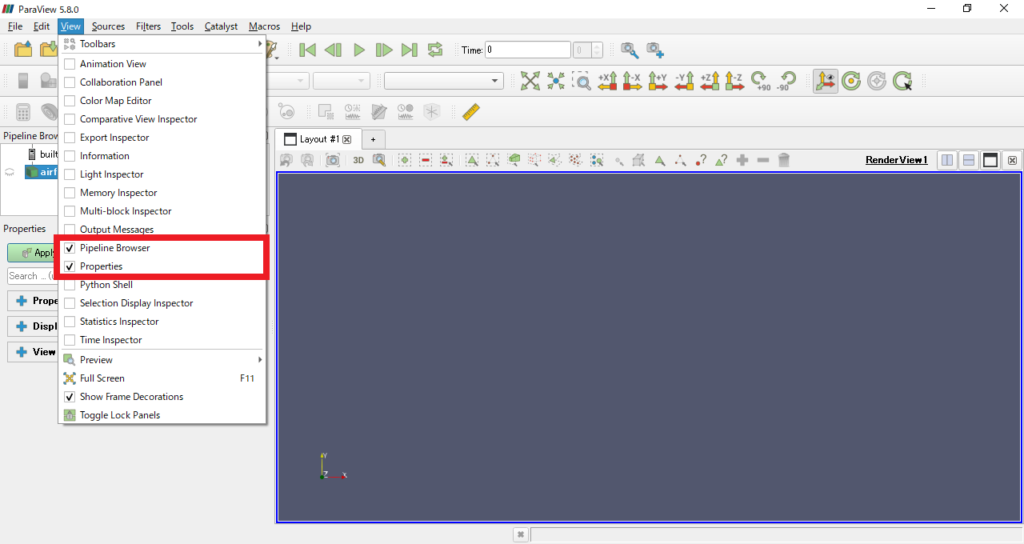
paraViewでairfoil.foamファイルを開いて,View→Pipeline BrowserとPropertiesにチェック
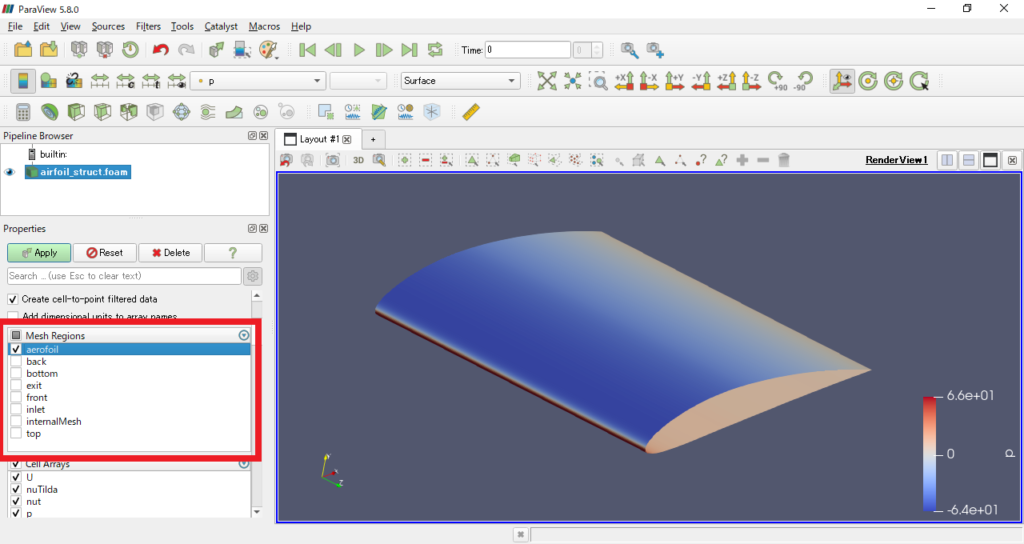
Properties→Properties→Mesh Regions→aerofoilにチェック
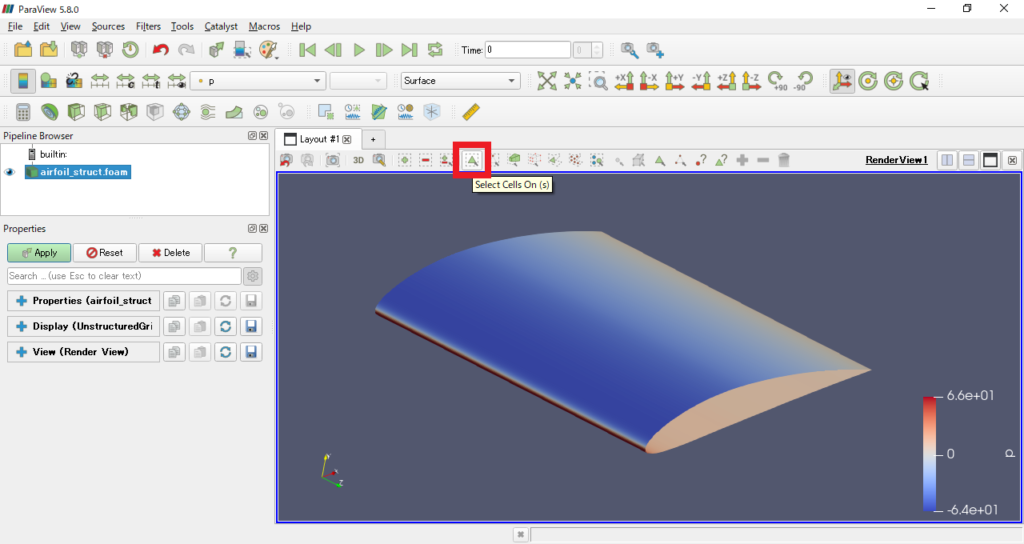
Select Cells On→aerofoil全体を選択
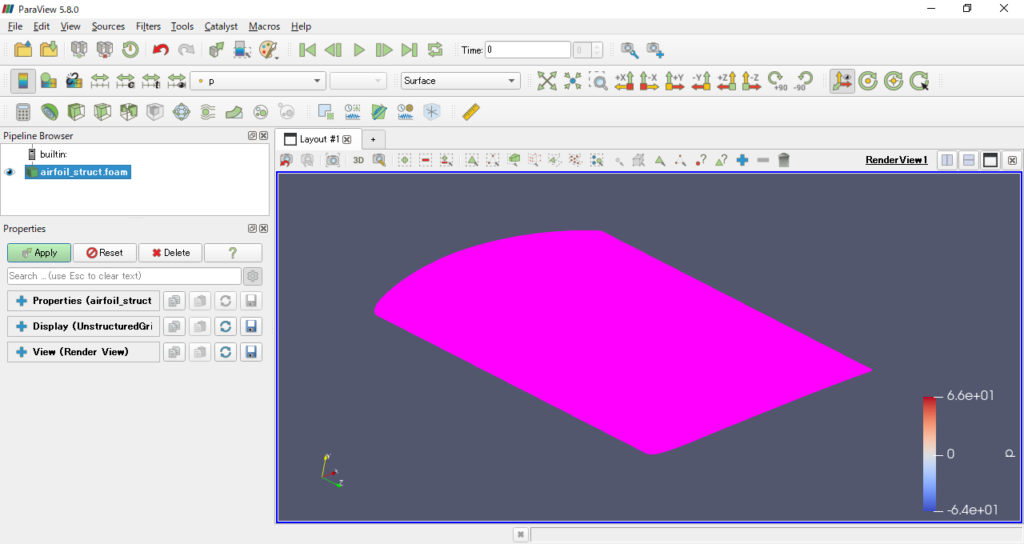
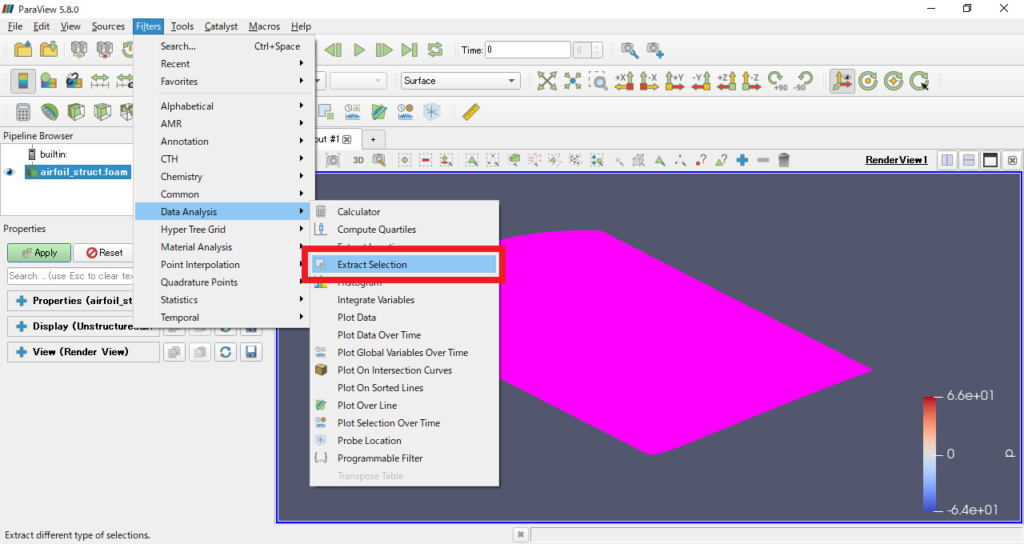
Filters→Data Analysis→Extract Selectionをクリック
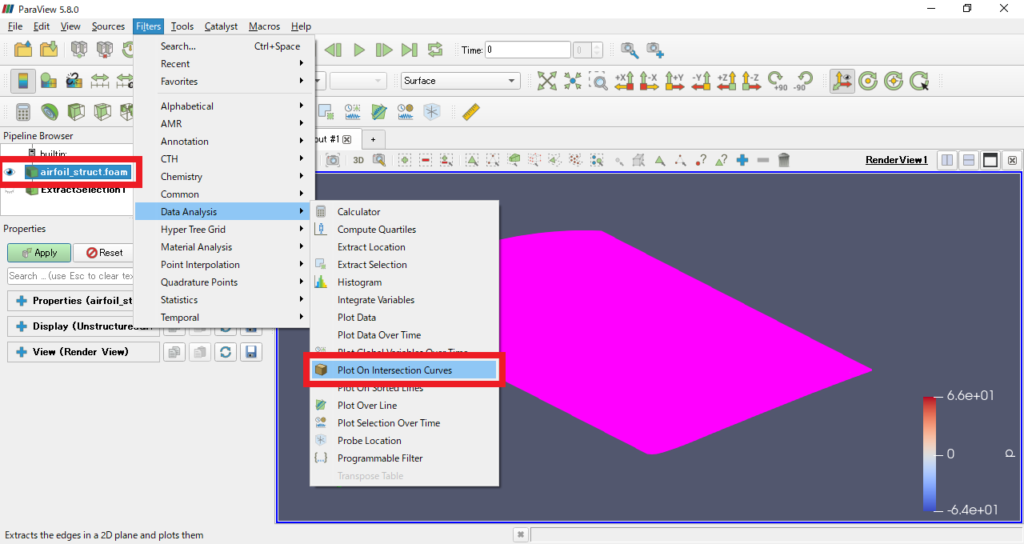
Pipeline Browserでairfoil.foamを選択しなおして,Filters→Data Analysis→Plot On Intersection Curvesをクリック
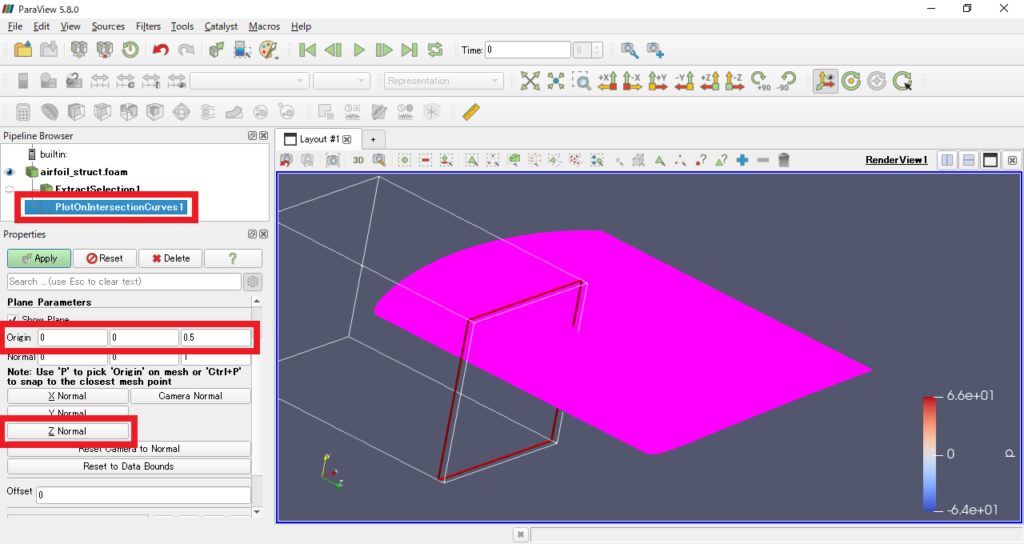
Pipeline BrowserでPlotOnIntersectionCurves1を選択して,Properties→Properties→Plane Parameters→Z Normalをクリックし,Originに[0, 0, 0.5]を入力してからApplyをクリック
右側にグラフが表示されるので,Properties→Display→Series Parametersの中から可視化したい項目にチェックを入れる
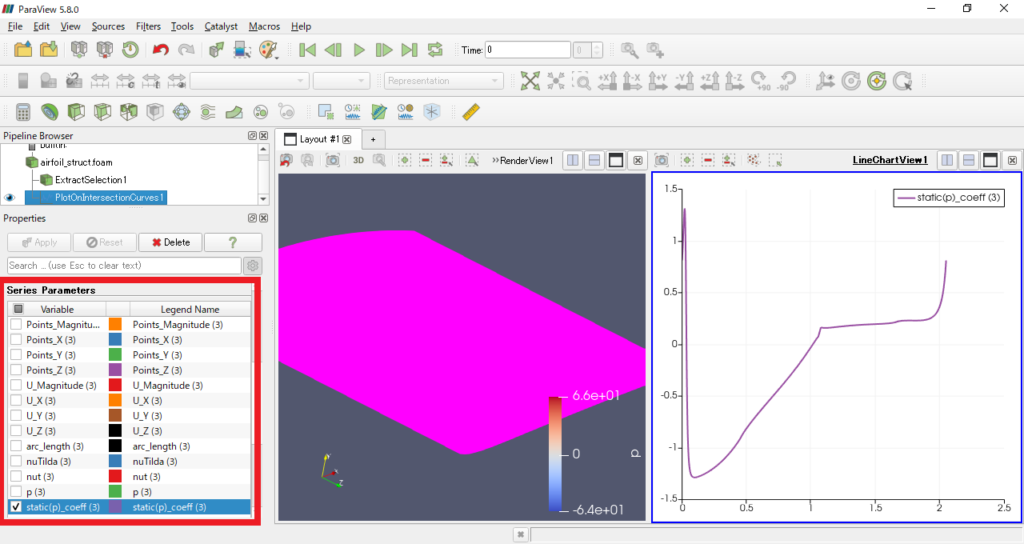
これで翼表面の圧力分布のグラフを表示することができた
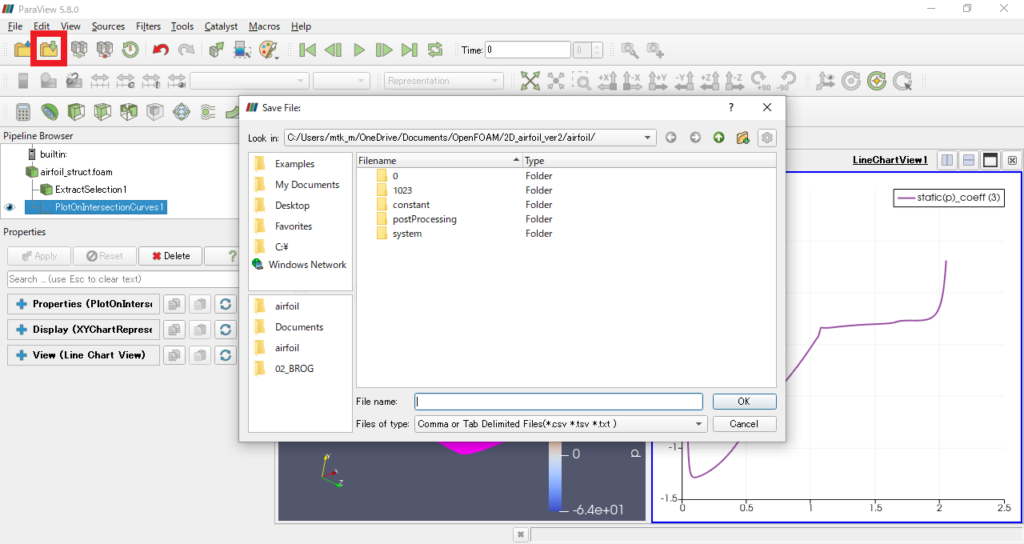
Save Dataをクリックすれば,csvファイルとして出力することもできる
結果
XFLR5との比較
空力係数と圧力分布について,XFLR5の解析結果と比較してみる
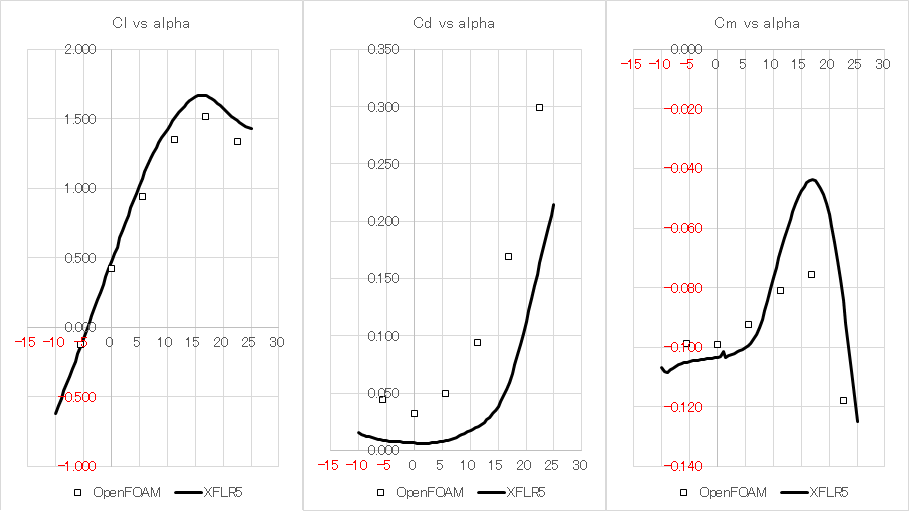
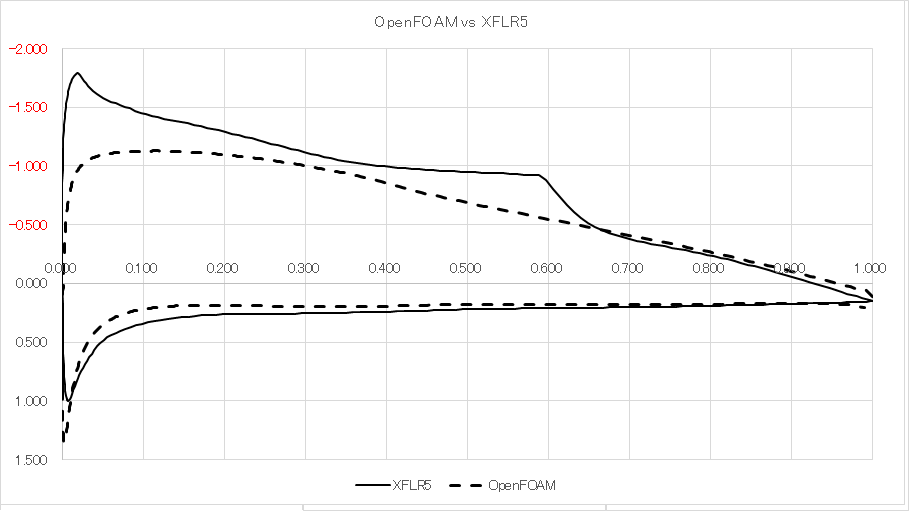
まあ,素人が見様見真似で作ったメッシュによるCFDなんてこんなもんである
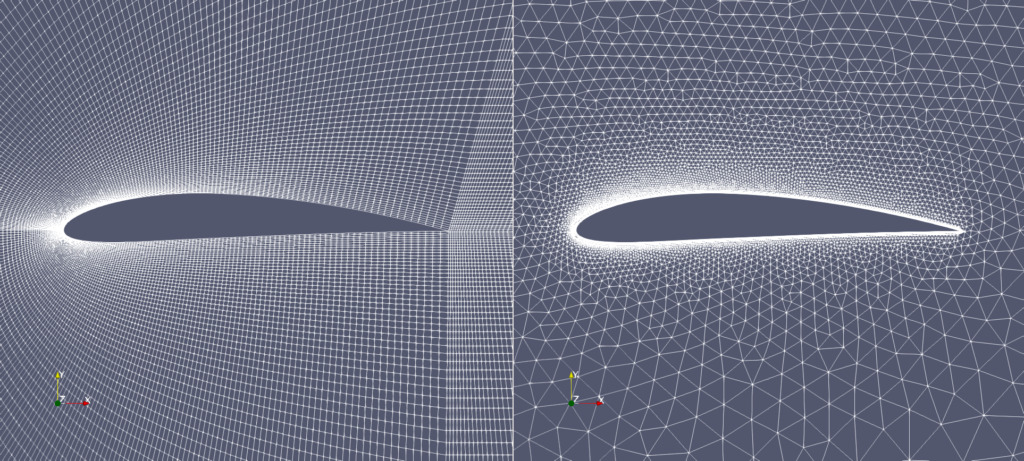
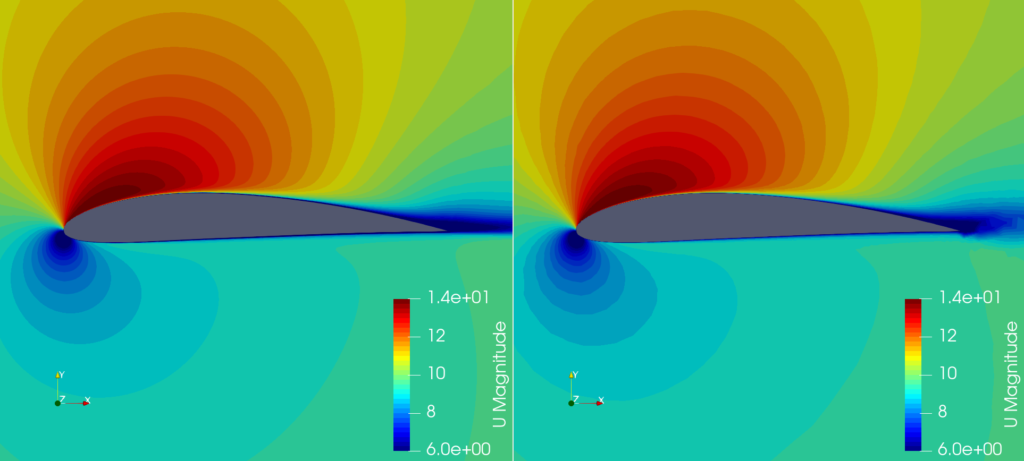
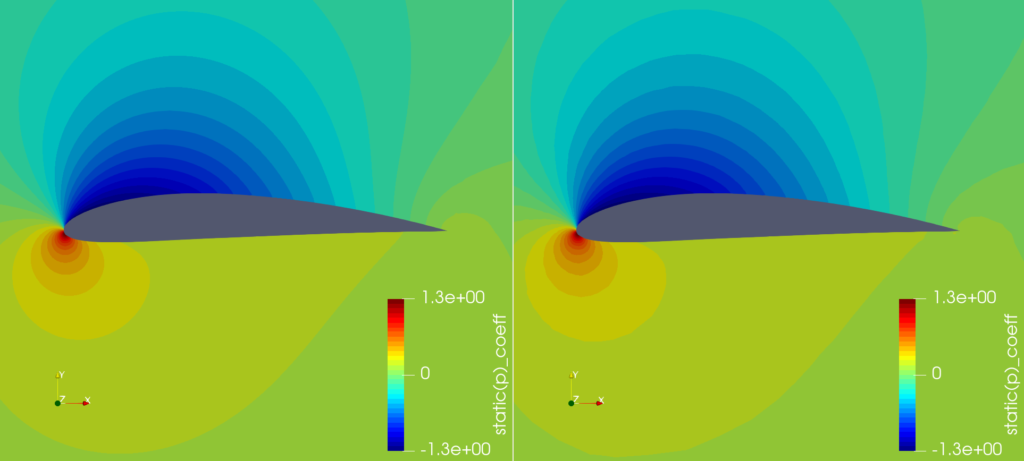
構造格子と非構造格子の比較
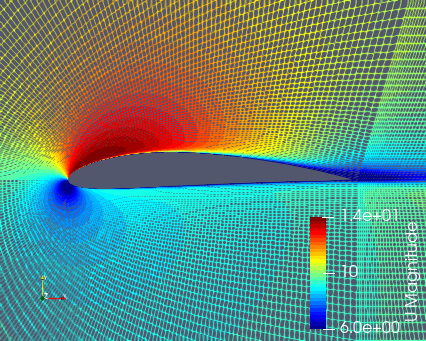
構造格子と非構造格子で速度場と圧力場を比較してみる
まとめ
いろいろな種類のメッシュを切れるになり,揚力係数や抗力係数を計算できるようになった
メッシュの切り方に関してはずぶの素人なので,これから勉強していこうと思う
↓関連記事

コメント